Grundy 44% efficiency but I don't think anyone would dare say he had a bad game.
Happy for Grundy to bomb it in long or handpass it to another player
Follow along with the video below to see how to install our site as a web app on your home screen.
Note: This feature may not be available in some browsers.
Grundy 44% efficiency but I don't think anyone would dare say he had a bad game.


Superb effort caesar88 . CBA's are easy to determine who is present but other stoppages are far more difficult. If possible, it would be great to know how many first touches vs no of attendances in either category but I would certainly understand if you said "Nah! Too hard!".LONG POST INCOMING
There's been a lot of discussion about our first usage in the midfield over the years. Is it an issue, is it overstated, how can we improve it, will the acquisition of Brodie Grundy help, etc. So this year I will endeavour to track it, and see what exactly is happening in that realm. It really isn't much trouble for me as I tend to watch replays of games anyway, so it requires just a tiny bit extra note-taking throughout. (Yes I'm a geek, don't judge.) That is, if anyone is interested.
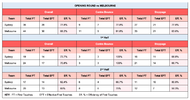
From a team perspective, I thought I'd look at a few different categories: total number of first touches we got, the success rate of converting those first touches into clearances, where those first touches were won (ie. stoppages or centre bounces), and how we faired in the first and second halves of the game.
Total number of first touches won:
Sydney Swans - 35
Melbourne - 42
Success rate of those first touches:
Sydney Swans - 77.14% (pr0n)
Melbourne - 54.76%
Where the first touches were won:
Centre bounces - 6
Stoppages - 29
Success rate of first touches in each area:
Centre bounces - 83.3% (pr0n)
Stoppages - 75.86% (pr0n)
Breakdown of the two halves:
Total number of first touches won:
1st Half:
Sydney Swans - 19
Melbourne - 23
2nd Half:
Sydney Swans - 16
Melbourne - 19
Success rate of those first touches:
Sydney Swans:
1st Half - 14 of 19 first touches successful for a rate of 73.68%
2nd Half - 13 of 16 first touches successful for a rate of 81.25% (pr0n)
Melbourne:
1st Half - 15 of 23 first touches successful for a rate of 65.22%
2nd Half - 8 of 19 first touches successful for a rate of 42.1% (pr0n)
Where those first touches were won:
Centre bounces (Swans only):
1st Half - 3 of 3 first touches successful for a rate of 100% (computer virus detected)
2nd Half - 2 of 3 first touches successful for a rate of 66.67%
Stoppages (Swans only):
1st Half - 11 of 16 first touches successful for a rate of 68.75%
2nd Half - 11 of 13 first touches successful for a rate of 84.62%
Individuals:
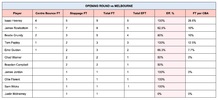
From an individual perspective, I looked at each player's total number of first touches won, and the success rate of those first touches. There was simply too much change in personnel at each stoppage and centre bounce to track each player's numbers when broken down into areas and halves, so apologies on that front.
Total number of first touches won:
Isaac Heeney - 9
James Rowbottom - 8
Brodie Grundy - 6
Errol Gulden - 4
Tom Papley - 3
Justin McInerney - 1
Braeden Campbell - 1
James Jordon - 1
Chad Warner - 1
Sam Wicks - 1
Ollie Florent - 1
Success rate of those first touches:
(Only counting the top five - everyone else only had a single first touch, which is harder to read.)
Isaac Heeney - 100%
Tom Papley - 100%
James Rowbottom - 61.54%
Brodie Grundy - 50%
Errol Gulden - 50%
What it all means:
Well, from a team perspective, I think it shows we did pretty damn good. Even with a great performance like Grundy, we need to remember that Max Gawn is still Max Gawn. At his best, his tap-work is just unmatched in the competition and he still showed glimpses of it the other night. So to come away with only 7 less first touches of the footy is I think a pretty good outcome.
But the tale of the tape is really efficiency. We had less first touches across the entire game and in both halves of the game, but we were 23% better at converting those first touches into clearances across the game than Melbourne were, 8% better at it in the first half, and nearly 40% better at it in the second half. We didn't drop below a 75% success rate across the whole game in either centre bounces or stoppages.
It shows we were clean when it was our turn, and then effectively pressured Melbourne's mids when it was their turn.
This brings me to the individuals...
Watching this game back and focusing on those first possessions really emphasised to me that Heeney just had one of the great games from a Swans midfielder, quite possibly the best we've seen in years. Not only did he win the most first possessions of any Swans player on the night, but every single one of them was effective in becoming a clearance. Papley might've also only had 3 first possessions, but they proved effective as well.
I think it also highlights how slept on Rowbottom is. He may not be versatile or a utility, but he is the all-rounder of our midfield. Eight first possessions and five of them being effective at becoming clearances is very good going. When combined with the fact you know it was him doing the most damage when it came to stifling Melbourne's first possessions the other way, you couldn't ask for much more from a player.
We know that Gulden didn't have his best night, and that it was Grundy's first hit-out in the red and white, so there is still every possibility he only builds on what he showed the other night, meaning there's upside in these two. When you consider the likes of Warner barely impacted in this regard all night, it's a very good base to be building the season on.
Just on Grundy, similarly to Rowbottom, his ability to follow-up even when he didn't win the ball was so important. It's really all you can do as a midfielder (which I am counting Grundy as here) - try and win the ball, if that fails, fight like hell to win it back.
Will try to post these regularly, will be good to track the team and the individuals and compile the numbers over the course of the year if there's interest.
That makes a lot of sense! And it's a very good point re the info needing to be condensed. I don't really think of that as I'm typing it, I just get it down but of course it would be a bit of a pain to read.Great stuff Caesar, I love stats, so will be checking in regularly.
Just thought I'd make a suggestion, feel free to disregard if you think it's a poor suggestion.
It would be good if you could include a table to make the info easier to digest (provided tables are an option for you).
For example, the following can be summarised
Where the first touches were won:
Centre bounces - 6
Stoppages - 29
Success rate of first touches in each area:
Centre bounces - 83.3% (pr0n)
Stoppages - 75.86% (pr0n)
With a 3 x 2 table, and adding the actual figures along with the % to add the additional context.
Where first touches were won - Success rate
Centre bounces (6) - 5 / 6 (83.3%)
Stoppages (29) - 22 / 29 (75.86%)
There are probably a few other tweaks you can make to condense the info. I just found myself bouncing around the screen to get the info i was after.
Edit: I didn't use a table because I'm posting on my phone so the suggested isn't formatted well. But the dashes represent the division between the two rows.
Thanks Caesar, only suggesting it if it isn't too much additional burden. The fact that you interpret the stats at the end gives the additional context so it's not entirely necessary, but would be handy if it's easy enough to do.That makes a lot of sense! And it's a very good point re the info needing to be condensed. I don't really think of that as I'm typing it, I just get it down but of course it would be a bit of a pain to read.
I will try and conjure a table!
One more thing, kinda related. My feeling is that McLean played a smaller but still significant role in wearing Max down. He got 10 hitouts but I would love to know who he went up against and how he went specifically against Gawn. One analyst made comment on it but I lost who.Superb effort caesar88 . CBA's are easy to determine who is present but other stoppages are far more difficult. If possible, it would be great to know how many first touches vs no of attendances in either category but I would certainly understand if you said "Nah! Too hard!".
Thanks again. Enthralling.
Your stuff is both more interesting and more useful.Muahaha... that was my plan all along - to put Champion Data out of business
Your stuff is both more interesting and more useful.
Great presentation caesar88 with the changes.Post about our first possessions now amended with a table to hopefully make it easier to understand the info!

LOL I have absolutely no idea how that happened. I must've been rather confident in that figure too because I double and triple checked the maths on all of the results but obviously didn't see fit to amend that one!A small point but: I'm curious how the maths in figuring out Rowy's % of SFTs went wrong? 5/8 is normally 62.5%.
I think this is back to front. Our K:H was much higher than Melbourne. We also had more I50.
I'll update this every week and work on the filters shortly.
Question - do you want the Opposition Stats in there or just the Swans?
