
grumbleguts
User name to post ratio checks out
If we plot hit outs in every game this season against team score there is a moderate correlation, this however is expected regardless of the effect of the number of hit outs on scoring, there is a profound effect the other way. ie scoring causes hit outs. (The more goals you kick the more centre bounces you attend.
The relationship between hit outs and score this season has thus far had a correlation coefficient of 0.68. The equation for the relationship is:
s = 4.98h + 32.49.
This means that there is on average roughly 5 points scored per hit out with a baseline score of 0 hit outs giving a score of 32.5

Given that there is a clear cause of increased hit outs against score line (goals cause centre bounces), perhaps a look at hit out differential against score differential will paint a different picture.
There is a very weak correlation here. The correlation coefficient between score differential and hit out differential is only 0.35. (0.25 isconsidered no correlation, 0.5 is the border between weak and moderate)
If however 5 outliers are removed form the data set, the correlation coefficient improves to a respectable 0.63. However we can't do that because those games happened.
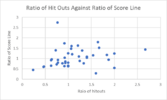
When we look at ratio of hit outs against ratio of score line, the correlation is so low it is considered non existent. r = 0.20
SO there doesn't seem to be any correlation between ruck hit outs and score line.
One last thing, I noticed when looking this data up that there appeared to be a large home ground advantage (HGA) to the home ruck man in ruck contests, at least earlier on, so I plotted a graph of games as they occurred against whether that game contributed to the HGA, adding one for each game where the home ruck man had the advantage and subtracting one if he lost the hit out differential. Over all games so far this season it is an interesting result.
The relationship between hit outs and score this season has thus far had a correlation coefficient of 0.68. The equation for the relationship is:
s = 4.98h + 32.49.
This means that there is on average roughly 5 points scored per hit out with a baseline score of 0 hit outs giving a score of 32.5

Given that there is a clear cause of increased hit outs against score line (goals cause centre bounces), perhaps a look at hit out differential against score differential will paint a different picture.
There is a very weak correlation here. The correlation coefficient between score differential and hit out differential is only 0.35. (0.25 isconsidered no correlation, 0.5 is the border between weak and moderate)

If however 5 outliers are removed form the data set, the correlation coefficient improves to a respectable 0.63. However we can't do that because those games happened.
When we look at ratio of hit outs against ratio of score line, the correlation is so low it is considered non existent. r = 0.20

SO there doesn't seem to be any correlation between ruck hit outs and score line.
One last thing, I noticed when looking this data up that there appeared to be a large home ground advantage (HGA) to the home ruck man in ruck contests, at least earlier on, so I plotted a graph of games as they occurred against whether that game contributed to the HGA, adding one for each game where the home ruck man had the advantage and subtracting one if he lost the hit out differential. Over all games so far this season it is an interesting result.


 DRAGONS FFC


 Ophidian Old Boys


