- Joined
- Jul 20, 2006
- Posts
- 2,298
- Reaction score
- 3,031
- Location
- Oxfordshire, UK
- AFL Club
- Adelaide
- Other Teams
- Glenelg
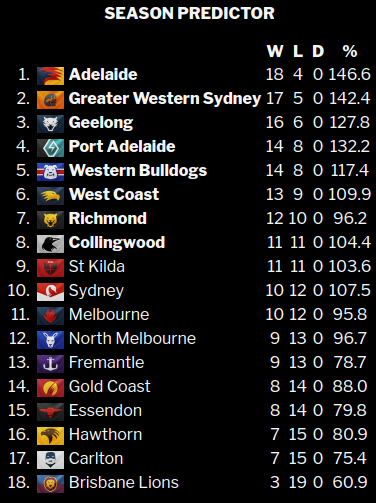
Interesting read this week Max and great to see all the movement. I noted you mentioned St Kilda's state is really only as a result of the Hawthorn take down. In a similar vein, media leading up to last weekend was only about the few wins we had with no mention of being 'in' games (matching) Cats and WC until the 4th quarter. Class and running out of gas getting us easily both times. Is there any modelling which looks beyond the final siren score?
There's always Roby's advanced calculus.
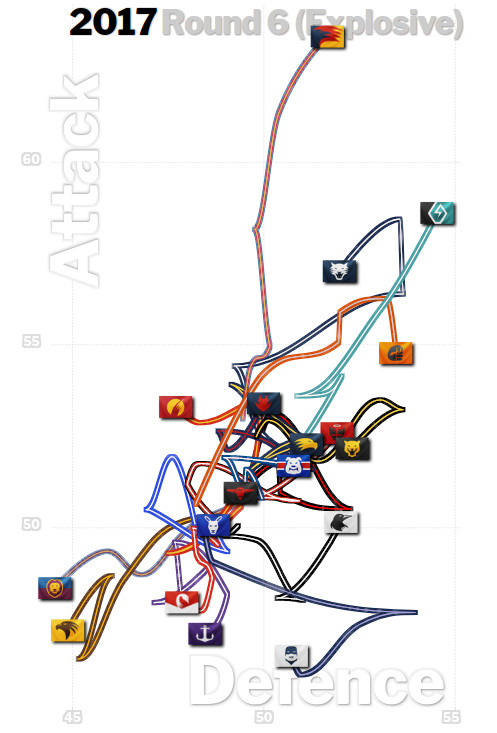
I model on the final siren score and very little else, but that's the whole score, not just the win-loss.

")