Stats That Matter

Remove this Banner Ad

Has there ever been a club that has had two different Coleman medallists in consecutive seasons? Charlie a real chance after Harry got it last year.
Yes, in 1899 Geelongs Eddie James claimed it with 31
The following year in 1900 Geelongs Teddy Lockwood tied with * Albert Thurgood both with 24 to win it.
The following year in 1901, *'s Fred Hiskins won it with 34.
These are the only times its occurred.
Franklin in 2011 and Roughy in 2013 is the closest its got.
 
How different is finals compared to home and away footy?

Screen Shot 2022-06-24 at 11.51.32 am.png

Screen Shot 2022-06-24 at 11.52.44 am.png

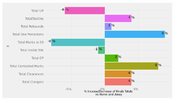
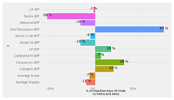
Looking at AFL over the last 2 decades, we can see some pretty interesting narratives. Games are not only closer on average for finals but also lower scoring, by about 5 points each.

Interestingly the tackle differential of the winning team has decreased by 58%, even though we are seeing 4% more tackles being made in these high pressure games.

Teams that win finals have increased their contested possession differential by 19% even though total contested possessions only increases by 2%. The clearance differential increases by 35% even though there are only 4% more total clearances during a game and their one percenter differential increases by 83% while total one percenters in finals games only increases by 8%.
 
I understand people's interest in stats and how club officials use them for this and that but personally I have to say, they have zero to do with my enjoyment, assessment or satisfaction with our great game - and if this following is considered an "interesting narrative", I'm seriously missing something:

Looking at AFL over the last 2 decades, we can see some pretty interesting narratives. Games are not only closer on average for finals but also lower scoring, by about 5 points each.

Really?
 

Log in to remove this ad.

I understand people's interest in stats and how club officials use them for this and that but personally I have to say, they have zero to do with my enjoyment, assessment or satisfaction with our great game - and if this following is considered an "interesting narrative", I'm seriously missing something:

Looking at AFL over the last 2 decades, we can see some pretty interesting narratives. Games are not only closer on average for finals but also lower scoring, by about 5 points each.

Really?
Season 5 Reaction GIF by The Office
 
I understand people's interest in stats and how club officials use them for this and that but personally I have to say, they have zero to do with my enjoyment, assessment or satisfaction with our great game - and if this following is considered an "interesting narrative", I'm seriously missing something:

Looking at AFL over the last 2 decades, we can see some pretty interesting narratives. Games are not only closer on average for finals but also lower scoring, by about 5 points each.

Really?

That doesn't sound like much, but is actually a decent difference statistically.
 

You may not care, but..... finals scores being 5 points lower than H&A matches is ~5.8% difference.

Most team/game stats are pretty similar over the long term. A 5.8% difference can be huge. To show you how significant....

In 2022, a 5.8% difference

Is the difference between 1st and 9th when ranking teams by disposals
Is the difference between 1st and 10th when ranking teams by marks


Also, shouldn't it be fme (f me extinct)?
 

(Log in to remove this ad.)

How different is finals compared to home and away footy?

View attachment 1431144

View attachment 1431151

Looking at AFL over the last 2 decades, we can see some pretty interesting narratives. Games are not only closer on average for finals but also lower scoring, by about 5 points each.

Interestingly the tackle differential of the winning team has decreased by 58%, even though we are seeing 4% more tackles being made in these high pressure games.

Teams that win finals have increased their contested possession differential by 19% even though total contested possessions only increases by 2%. The clearance differential increases by 35% even though there are only 4% more total clearances during a game and their one percenter differential increases by 83% while total one percenters in finals games only increases by 8%.
This bodes well for us.
 
Having a look at the team stats, the 2 that we are worst - 18th for hitouts and 16th for tackles. Probably confirms what we already knew. We actually sit in the top 3 for numerous stats, 1st for disposals, 3rd for contested footy, 4th for disposal efficiency and 2nd for contested marks. Plenty to suggest we should be right up there, but breaking down somewhere along the line.
 

Remove this Banner Ad

Back
Top