- Joined
- Aug 26, 2015
- Posts
- 7,703
- Reaction score
- 16,459
- Location
- Pile of Melted servers
- AFL Club
- Richmond
Urge to kill, fading.......Ahh the Squiggle! Teacher. Mother. Secret lover...
Follow along with the video below to see how to install our site as a web app on your home screen.
Note: This feature may not be available in some browsers.

Urge to kill, fading.......Ahh the Squiggle! Teacher. Mother. Secret lover...
Good to see someone with that avatar got that reference.Urge to kill, fading.......
Last year I started paying more attention to this kind of thing. I found three things mainly affect tip accuracy:Final Siren
Probably been answered before, but interested to know the Squiggles tipping percentage for early in the year v later in the year.
My only thoughts were that the predicted ladder only has teams moving 2-3 spots generally. I understand the reasons for this, but am curious as to whether this affects early season (say first 6 rounds) tipping results as the Squiggle adjusts, because there's always a bolter or 2 and a slider or 2, compared to later in the year when it's motoring along?
Or does the Squiggle somehow tip consistently from round 1, and if so, what's the theory for that?
Cheers
That. It's incredibly grating when fans of historically strong clubs belittle the opinions of other fans merely because they've followed a team devoid of success. Maybe next time remember you haven't won a final for 13 years, so we can all play that card.

Log in to remove this Banner Ad
I believe it was in a poker game back in '92.Squiggle predicting Longmire beating Beverage in all three meetings!
When was the last time Longmire beat beverage?
Last year I started paying more attention to this kind of thing. I found three things mainly affect tip accuracy:
Margin is by far the biggest factor, of course.
- Margin: The greater the predicted margin, the more likely the tip is to be correct.
- Round Number: Games that occur later in the season are more likely to be tipped correctly.
- Weeks Until Game: Games that are far in the future are less likely to be tipped correctly.
Round Number is fairly significant, with average tip accuracy rising from about 66% at the start of the year to about 70% by mid-year.
And Weeks Until Game is significant, but less so than you'd think: squiggle only loses around 3 percentage points of accuracy tipping 20 weeks in the future vs tipping the current week. I posted about this last year, because it's funny how it's not much easier to tip Round 23 the week before than it is months and months before.
As for the ladder predictor, you're right that most seasons have at least one big bolter or slider -- just like most rounds of football have at least one big upset. But it's one thing to know there will be a surprise somewhere; it's another to say what the surprise will be. You will usually be more accurate by tipping the most likely outcomes all the time and just accepting that some will be wrong than by trying to guess the upset, unless you have some kind of special insight or inside info. So that's what squiggle does.
No beer and no TV make homer go something something..Urge to kill, fading.......

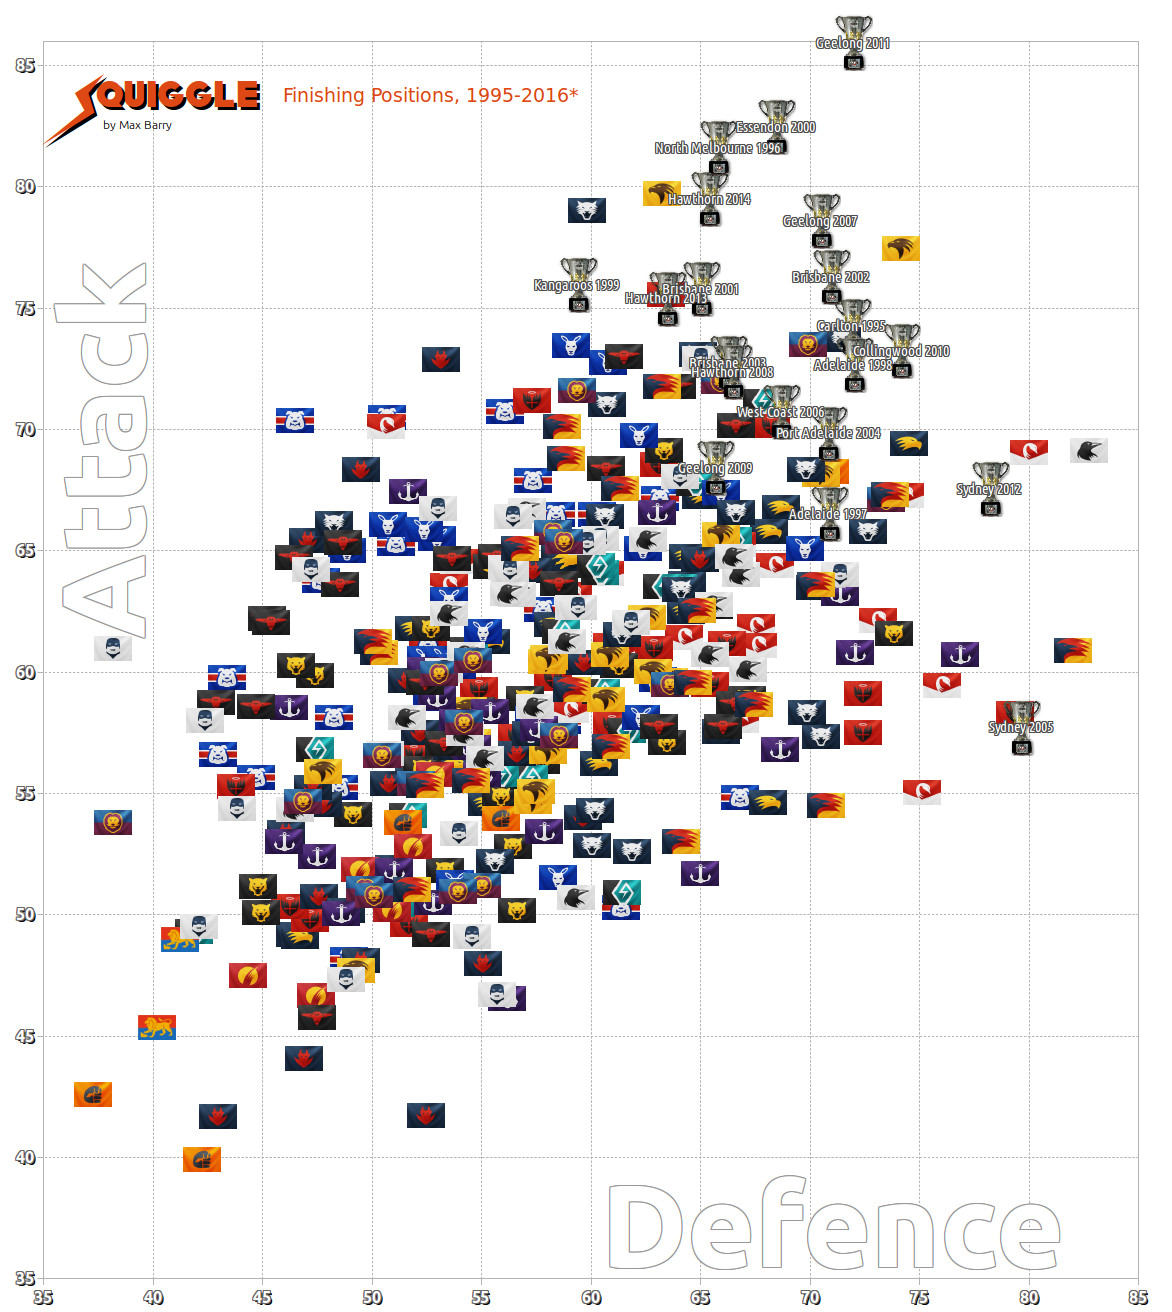
Do you sell this in poster size?Long and erect. You can probably imagine it from this image I posted last year:
GWS in 2012 and 2013 were absolute trash. They were so bad, they passed beyond our ability to categorize, because we think the bottom standard is Fitzroy. But Fitzroy 1996 were actually competitive before the VFL ripped out their hearts and they lost their last 3 games by an average of 108 points. GWS were rubbish from start to finish.
GWS were so bad that they made Melbourne 2013 look sort of all right, and they weren't. They were not all right.
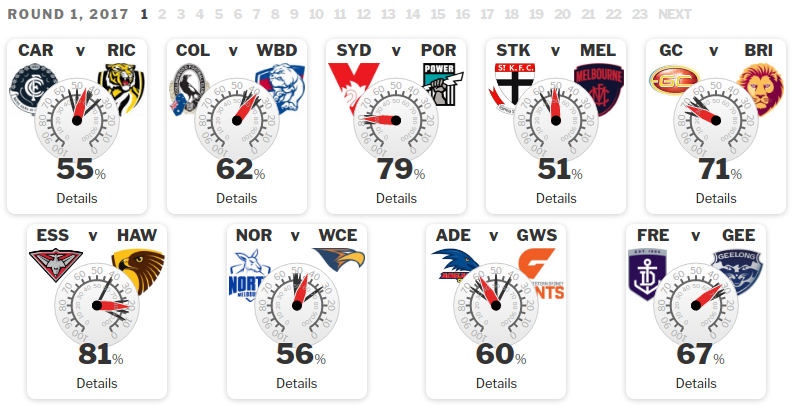
Squiggle Dials! Now I pull together tips from the best online models for you:
https://squiggle.com.au <-- I made a site
Currently looks like this:
My plan is also to post links there to online analysis from sites like The Arc, Figuring Footy, Matter of Stats, and FootyMaths Institute. Because they produce some really great stuff, which I think most people don't even notice. I'm not sure if I'll be able to keep up with this throughout the year, but I'll give it a shot.
Squiggle corrected for ump bias??How come the 2017 Bulldogs starting position is different to the 2016 Premiership Cup position?
That's a valid assumption if the models are better predictors than the bookies.Looks nice.
If one were to use this to assist in betting would I be right in saying that North @ $3 is probably a good bet, given the aggregate is about 50/50 for that one?
While Adelaide @ $2.35 would also be a good bet given they're slightly favoured.
Finally Hawks @ $1.61 seem good odds for the team rated most likely to win.
FTFYAnd
Sub
Squiggl
Ing
But how much is allowed for Bookies Bait? ie setting a price to attract more flies?That's a valid assumption if the models are better predictors than the bookies.
The real question is why there's a marked difference between the bookies and the models! There are quite a few R1 games like this. On the site, you can see that Punters (which are really bookies) are a lot more optimistic about Essendon's chances against the Hawks, for example, and more pessimistic about North's vs West Coast.
I find it goes the flipside a lot.But how much is allowed for Bookies Bait? ie setting a price to attract more flies?
Can you make them max out at 11?Squiggle Dials! Now I pull together tips from the best online models for you:
https://squiggle.com.au <-- I made a site
Currently looks like this:
My plan is also to post links there to online analysis from sites like The Arc, Figuring Footy, Matter of Stats, and FootyMaths Institute. Because they produce some really great stuff, which I think most people don't even notice. I'm not sure if I'll be able to keep up with this throughout the year, but I'll give it a shot.
Squiggle corrected for ump bias??
Off topic.Dear god we smacked you move on
Off topic.
Please talk about the glorious squiggle.