Navigation
Install the app
How to install the app on iOS
Follow along with the video below to see how to install our site as a web app on your home screen.
Note: This feature may not be available in some browsers.
More options

-
Mobile App Discontinued
Due to a number of factors, support for the current BigFooty mobile app has been discontinued. Your BigFooty login will no longer work on the Tapatalk or the BigFooty App - which is based on Tapatalk.
Apologies for any inconvenience. We will try to find a replacement.


You are using an out of date browser. It may not display this or other websites correctly.
You should upgrade or use an alternative browser.
You should upgrade or use an alternative browser.
Resource Beyond the "66 Game" Rebuild
- Thread starter FlowersByIrene
- Start date
- Tagged users None
🥰 Love BigFooty? Join now for free.
Dramoth
Premium Platinum
- Apr 29, 2012
- 28,251
- 43,432
- AFL Club
- Carlton
- Thread starter
- #28
OP has been updated to include Official AFL Player Ratings for each player pinpointed at the point in time of the match. This data has been added together to get a total figure across all "youth" and then averaged out to show the average rating of the youth in our side.
The AFL Player Ratings system is heavily weighted to long term success, and takes years to build high ratings. Therefore, rookies such as Weitering and Curnow will bring the Average Player Rating of our youth down, what we aim to see represented in this graph is a steady trend upwards as our youth develops and improves, however debutant players will halt this upwards process as seen by the hit the average took upon the introduction of Charlie Curnow in Round 2 and Ciaran Byrne in Round 3.
The sign of a successful rebuild will be one that steadily climbs after a period of dips where fresh players are blooded.
- Apr 29, 2012
- 28,251
- 43,432
- AFL Club
- Carlton
- Thread starter
- #29
ROUND 4 UPDATE
The addition of fresh young blood saw us field our highest number of youth in any game so far this season, this however meant our "overall average player rating" dipped, with the addition of rookies such as Sumner. However in a noticeably good trend Docherty, Cripps, Kerridge, Weitering, Curnow, Sumner and Byrne continue to increase their ratings, Plowman stayed relatively steady with this performance but should work his way into fitness whilst Lamb, treated harshly by this system fell despite a quality performance and Buckley and Graham fell after poorer showings.
I believe we are starting to build this youth engine positively, and I think, as we have an easier run in games coming up with Fremantle, Collingwood and Essendon we will see the trend start to move upwards.
2016 AFL PREMIERSHIP SEASON
View attachment 237196
Graph: graphical representation of number of "youth" selected in the best 22 (Series 1) along with that youth's performance, by way of AFL Coaches Association votes (Series 2) and average youth player rating* (Series 3)
* Avg Player Rating = total player rating / number of players.
GAME 4 Rnd 4 - LOSS vs Western Bulldogs (49-85)
11 Youth Players: Jacob Weitering, Lachie Plowman (Blues Debut), Sam Docherty, Nick Graham, Liam Sumner (Blues Debut), Charlie Curnow, Ciaran Byrne, Jed Lamb, Dylan Buckley, Patrick Cripps, Sam Kerridge
OUT: Michael Jamison (Omitted) Mark While (Omitted) Blaine Boekhurst (Hamstring)
IN: Lachie Plowman, Liam Sumner, Jed Lamb
Coaches Votes: Sam Docherty (1)
Player Ratings Points:
In a tough night for the boys, despite effort, it was the youth who shined through a darker result. Sam Kerridge picked up 26 disposals and sent the ball inside fifty 4 times showing his ability to find the ball and progress it forwards. Sam Docherty was one of the best blues on the nigh constantly linking play and making big statements with 10 marks and 25 disposals. Patrick Cripps continued to look hampered by a knee injury and subsequently spent some time forward, kicking 1 goal 2, but he also couldn't avoid the centre circle, working hard, especially in the last half after giving away a few free kicks in the early part of the game, finishing with 23 disposals, 4 marks and a huge 8 tackles Cripps showed even not fully fit he's a weapon to contain. Liam Sumner showed something on debut, kicking 2 goals, but playing a deep forward role could only find 7 touches. Lachie Plowman debuted and showed the blues a defenaive partnership to be proud of with Weitering. Plowman carried well off half back and affected the contest, even collecting 2 marks in his 10 disposals. Jacob Weitering had a quieter game from a statistical standpoint, but still managed 15 disposals, 5 marks and whilst unluckily giving away a couple of free kicks did a big job on the Bulldogs defenders looking classy and polished. Charlie Curnow had one of his most prolific nights picking up 15 disposals and showing flashes of brilliance such as swinging out of a tackle and delivering the ball long, he couldn't find the goals but picked up 15 disposals.Dylan Buckley struggled again, despite kicking a goal after a Lamb handpassed he also dropped marks and seemed to struggle on the first touch, he had 12 disposals and 2 inside 50's. Nick Graham had his worst game for the season, unable to work his way into the game he had 12 touches but laid 4 tackles. Jed Lamb did a lot of good things and looked smooth and accurate with the ball in hand, taking 6 marks, kicking a goal and having 13 touches. Ciaran Byrne continued to find his feet at AFL level, getting caught by some free kicks but had some dash off half back with 15 touches, 4 marks and an inside 50.S. Docherty - 310.2
P. Cripps - 262.2
D. Buckley - 148.6
N. Graham - 116.4
S. Kerridge - 111.7
L. Plowman - 82.9
J. Lamb - 69.9
J. Weitering - 47
C. Curnow - 24.6
C. Byrne - 20.3
L. Sumner - 12
Avg: 109.6
Northern Blues Watch: Jaksch bags 3, Gorringe 2 and Cunningham 1, Dick and Gowers find the footy in the Northern Blues win over Geelong. https://www.bigfooty.com/forum/threads/track-the-66-game-rebuild.1129290/page-2#post-43914417
Log in to remove this Banner Ad
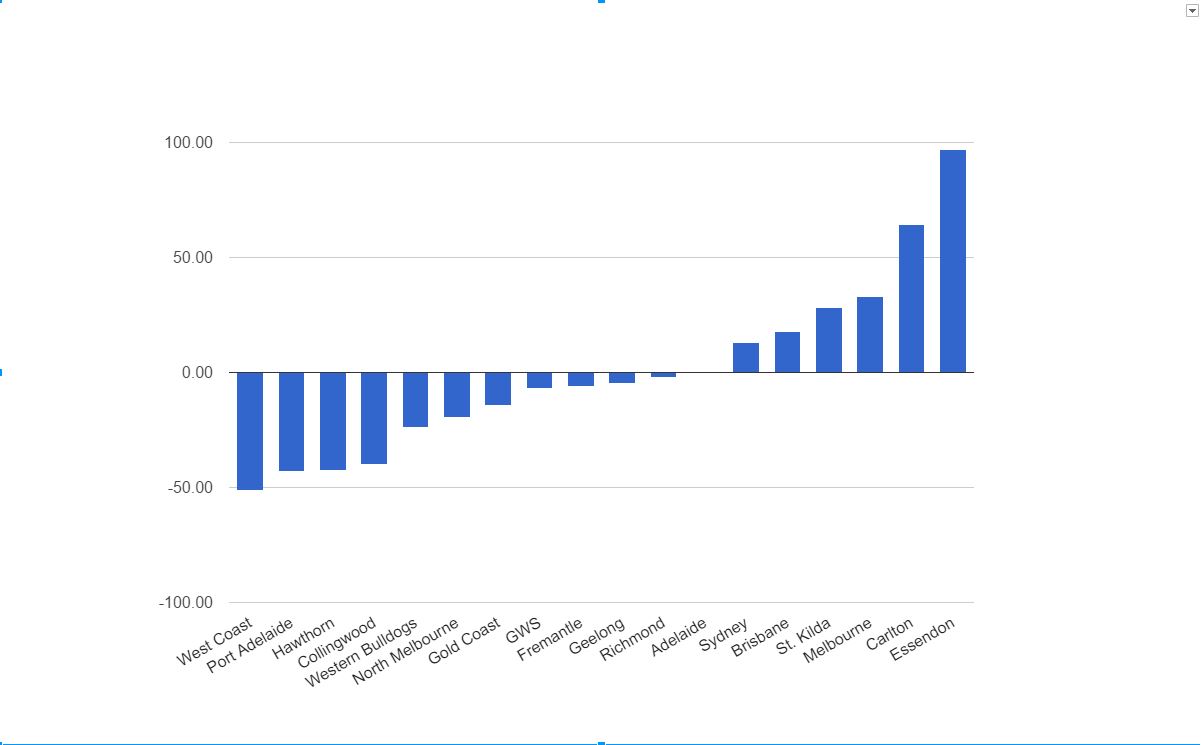
Just thought I'd put this in here as a base to see how we stack up against the rest of the competition. Hope I'm not cutting your grass Flowers!!!
Now I know this is FAR from perfect, but it does give us some measurable metric and a base point to compare how we are progressing through the 66 games.
What I've done is simply take the top 30 players from each team* (30 being the not so arbitrary figure as that is the number bandied about by pundits when assessing depth) and averaged their ranking using the AFL Player Ratings. I've then averaged out the whole competition and compared each team to the competition average. West Coast have the lowest average player rating, therefore they are well under the average, Essendon's ratings are well above average. Not perfect, but an interesting little exercise none the less.
Obviously, this doesn't take in to account things such as age, coaching, form etc. It's merely a measurable snapshot of right now.
*Essendon banned players have been removed for the purpose of this.
As you can see, we have a looooooong way to go, but what an exciting time it'll be! It will be interesting to see what this same chart looks like 12 months from now.
- Apr 29, 2012
- 28,251
- 43,432
- AFL Club
- Carlton
- Thread starter
- #31
Wait so the lower average rating is the better side?Just thought I'd put this in here as a base to see how we stack up against the rest of the competition. Hope I'm not cutting your grass Flowers!!!
Now I know this is FAR from perfect, but it does give us some measurable metric and a base point to compare how we are progressing through the 66 games.
What I've done is simply take the top 30 players from each team* (30 being the not so arbitrary figure as that is the number bandied about by pundits when assessing depth) and averaged their ranking using the AFL Player Ratings. I've then averaged out the whole competition and compared each team to the competition average. West Coast have the lowest average player rating, therefore they are well under the average, Essendon's ratings are well above average. Not perfect, but an interesting little exercise none the less.
Obviously, this doesn't take in to account things such as age, coaching, form etc. It's merely a measurable snapshot of right now.
*Essendon banned players have been removed for the purpose of this.
As you can see, we have a looooooong way to go, but what an exciting time it'll be! It will be interesting to see what this same chart looks like 12 months from now.
- Jun 6, 2012
- 10,197
- 18,296
- AFL Club
- Carlton
- Other Teams
- Rampage
Lower number = higher rated. Number 1 is the best player in the comp etc.Wait so the lower average rating is the better side?
- Apr 29, 2012
- 28,251
- 43,432
- AFL Club
- Carlton
- Thread starter
- #33
Ah right, so its their position and not their "ranking points" gotchaLower number = higher rated. Number 1 is the best player in the comp etc.
bluebrew
Cancelled
- Dec 15, 2006
- 1,576
- 1,558
- AFL Club
- Carlton
- Other Teams
- Carlton, Carlton and only CARLTON
66 games to me means they believe we will be ready to compete in 2019
Just goes to show what a biased piece of crap these rating systems are when a rubbish team like Port are second.Just thought I'd put this in here as a base to see how we stack up against the rest of the competition. Hope I'm not cutting your grass Flowers!!!
Now I know this is FAR from perfect, but it does give us some measurable metric and a base point to compare how we are progressing through the 66 games.
What I've done is simply take the top 30 players from each team* (30 being the not so arbitrary figure as that is the number bandied about by pundits when assessing depth) and averaged their ranking using the AFL Player Ratings. I've then averaged out the whole competition and compared each team to the competition average. West Coast have the lowest average player rating, therefore they are well under the average, Essendon's ratings are well above average. Not perfect, but an interesting little exercise none the less.
Obviously, this doesn't take in to account things such as age, coaching, form etc. It's merely a measurable snapshot of right now.
*Essendon banned players have been removed for the purpose of this.
As you can see, we have a looooooong way to go, but what an exciting time it'll be! It will be interesting to see what this same chart looks like 12 months from now.
Ah right, so its their position and not their "ranking points" gotcha
Yep. It's the average "ranking" of the best 30 players in each team measured against the average of the entire comp.
For example, the average ranking is 279.23. Meaning that the 279th rated player (Matt Rosa) is the average.
West Coasts top 30 average out to be 228.13, significantly better than 279.13. Ours is 343.77.
Collingwood is fourth. Its almost a graph revealing the medias latent biases and assumptions about list quality isn't it? How long have members of the media been blowing smoke up Collingwoods ass? Ive heard plenty of those idiots suggesting they have a better list than GWS, the suns and the dogs.Just thought I'd put this in here as a base to see how we stack up against the rest of the competition. Hope I'm not cutting your grass Flowers!!!
Now I know this is FAR from perfect, but it does give us some measurable metric and a base point to compare how we are progressing through the 66 games.
What I've done is simply take the top 30 players from each team* (30 being the not so arbitrary figure as that is the number bandied about by pundits when assessing depth) and averaged their ranking using the AFL Player Ratings. I've then averaged out the whole competition and compared each team to the competition average. West Coast have the lowest average player rating, therefore they are well under the average, Essendon's ratings are well above average. Not perfect, but an interesting little exercise none the less.
Obviously, this doesn't take in to account things such as age, coaching, form etc. It's merely a measurable snapshot of right now.
*Essendon banned players have been removed for the purpose of this.
As you can see, we have a looooooong way to go, but what an exciting time it'll be! It will be interesting to see what this same chart looks like 12 months from now.
Got to give you credit for putting all that together. It'll certainly be interesting to watch how much, if at all, the medias perception of our list changes. Keep up the good work.
Collingwood is fourth. Its almost a graph revealing the medias latent biases and assumptions about list quality isn't it? How long have members of the media been blowing smoke up Collingwoods ass? Ive heard plenty of those idiots suggesting they have a better list than GWS, the suns and the dogs.
Got to give you credit for putting all that together. It'll certainly be interesting to watch how much, if at all, the medias perception of our list changes. Keep up the good work.
It's not necessarily media bias, but more an indication of list depth and possible quality of youth (i.e. not played enough games to get a high ranking). Look at Sydney for example. They have 7 players in the top 100 players, but they drop away a fair bit after that, and their bottom 6 are all ranked 500+, but in that bottom 6 are Callum Mills and Tom Papley who have been tearing it up for them in their first 4 games. It also indicates that whilst Swans players aren't ranked that high, they are well coached and play their roles brilliantly.
Port on the other hand only have two player ranked 500+ (and one of them is actually ranked 500th), they have the same amount of top 100 players as Sydney, but the core of the Port team are in the 200 to 400 bracket. And this chart obviously doesn't take into consideration the wheels falling off the team like Port or Collingwood have done thus far.
- Apr 29, 2012
- 28,251
- 43,432
- AFL Club
- Carlton
- Thread starter
- #39
The ratings system is more a reflection of consistent play rather than talent. That means that older, more experienced teams will have a lot more players who are more "highly rated". Collingwood, a team with an extensive squad of experienced depth such as Macaffer, Howe, Goldsack, etc etc all these players left over from the previous generation will have higher ratings than recent draftees. Just look at Weitering who is already better than half of Collingwood's team but he is placed below 500 due to the fact he's only played 3 games.It's not necessarily media bias, but more an indication of list depth and possible quality of youth (i.e. not played enough games to get a high ranking). Look at Sydney for example. They have 7 players in the top 100 players, but they drop away a fair bit after that, and their bottom 6 are all ranked 500+, but in that bottom 6 are Callum Mills and Tom Papley who have been tearing it up for them in their first 4 games. It also indicates that whilst Swans players aren't ranked that high, they are well coached and play their roles brilliantly.
Port on the other hand only have two player ranked 500+ (and one of them is actually ranked 500th), they have the same amount of top 100 players as Sydney, but the core of the Port team are in the 200 to 400 bracket. And this chart obviously doesn't take into consideration the wheels falling off the team like Port or Collingwood have done thus far.
I'd say the ratings are really only useful to adequately judge a team by (1) restricting it to best 22 only, as any more throws out the calculations based on age and experience and (2) is only good for comparing experienced teams. As younger teams will be unnecessarily biased.
Take Patrick Cripps, he's currently leading the AFL in contested possessions and clearances, but is ranked at 300 or so isnt he? Clearly that is under rating Cripps.
But regardless of that it is a useful metric, as the only other way would be to personally rank the players from 1-650 and that is a pointless and time wasting exercise.
Still i find it useful to use as a guide in this thread as players ratings do go up when they play well and down when they play bad, and is therefore a way of tracking development. However it must be combined with our own learned knowledge.
Blue and Silver
Brownlow Medallist
AFL player ratings are a pretty flawed system for assessing current form. They are best at looking at a players performance over several seasons.
A player must spend several seasons accumulating points, whether they performed exceptionally well or not before they crack the top tier. Only a truly exceptional burst of performance over an entire season can lift a player significantly.
TBH I don't like them as a rating method at all
A player must spend several seasons accumulating points, whether they performed exceptionally well or not before they crack the top tier. Only a truly exceptional burst of performance over an entire season can lift a player significantly.
TBH I don't like them as a rating method at all
Jimmae
Brownlow Medallist
The points system delivers weekly totals, which eventually build into a rolling average. That should iron out the concerns you have.The ratings system is more a reflection of consistent play rather than talent. That means that older, more experienced teams will have a lot more players who are more "highly rated". Collingwood, a team with an extensive squad of experienced depth such as Macaffer, Howe, Goldsack, etc etc all these players left over from the previous generation will have higher ratings than recent draftees. Just look at Weitering who is already better than half of Collingwood's team but he is placed below 500 due to the fact he's only played 3 games.
- Mar 26, 2015
- 13,112
- 24,048
- AFL Club
- Carlton
- Other Teams
- Melb Tigers, Bendigo Braves, Aussie NBA
The biggest problem with the ratings system for players like Cripps, is that it's a rolling average taken from their past 40 games. Cripps hasn't played 40 games yet, so his score is effectively incomplete.The ratings system is more a reflection of consistent play rather than talent. That means that older, more experienced teams will have a lot more players who are more "highly rated". Collingwood, a team with an extensive squad of experienced depth such as Macaffer, Howe, Goldsack, etc etc all these players left over from the previous generation will have higher ratings than recent draftees. Just look at Weitering who is already better than half of Collingwood's team but he is placed below 500 due to the fact he's only played 3 games.
I'd say the ratings are really only useful to adequately judge a team by (1) restricting it to best 22 only, as any more throws out the calculations based on age and experience and (2) is only good for comparing experienced teams. As younger teams will be unnecessarily biased.
Take Patrick Cripps, he's currently leading the AFL in contested possessions and clearances, but is ranked at 300 or so isnt he? Clearly that is under rating Cripps.
But regardless of that it is a useful metric, as the only other way would be to personally rank the players from 1-650 and that is a pointless and time wasting exercise.
Still i find it useful to use as a guide in this thread as players ratings do go up when they play well and down when they play bad, and is therefore a way of tracking development. However it must be combined with our own learned knowledge.
Interestingly, Weiters might have only played 4 games, so it's a VERY small sample size, but he's sitting on 47 points. Obviously anything can happen from here, but if you do a simple multiply to 40 games, that puts him at 470, which ranks him I think around 30ish in the league. That's without taking into account the expectation of natural improvement.
- Apr 29, 2012
- 28,251
- 43,432
- AFL Club
- Carlton
- Thread starter
- #43
I know they flash those totals up during the games but I actually couldnt see the weekly scores on the rating hub, maybe I was looking in the wrong place though.The points system delivers weekly totals, which eventually build into a rolling average. That should iron out the concerns you have.
I think the overall rating total is a good measure of the building youth however for this excercise.
Jimmae
Brownlow Medallist
Ah yup, my bad, they're not there at all.I know they flash those totals up during the games but I actually couldnt see the weekly scores on the rating hub, maybe I was looking in the wrong place though.
I think the overall rating total is a good measure of the building youth however for this excercise.
🥰 Love BigFooty? Join now for free.
- Apr 29, 2012
- 28,251
- 43,432
- AFL Club
- Carlton
- Thread starter
- #45
I'm sure there is some way to find them, maybe, i dunno hahaAh yup, my bad, they're not there at all.
Jimmae
Brownlow Medallist
You'd need to scrape the data weeklyI'm sure there is some way to find them, maybe, i dunno haha
Magruder
Brownlow Medallist
- Nov 14, 2012
- 12,670
- 21,220
- AFL Club
- Carlton
The 66 game rebuild started round 3 last year
Already a 3rd of the way through
nah... started this year
You don't start rebuilding using just players recruited by those idiots Rogers and Hughes. After 66 games very few will still be on the list.The 66 game rebuild started round 3 last year
Already a 3rd of the way through
We did apparently attempt a rebuild early last year under the chap with the grey moustache, but the so-called 66 game rebuild most definitely began after the recruitment of Bolts.
Similar threads
- Replies
- 13
- Views
- 2K
- Replies
- 1K
- Views
- 20K
- Replies
- 912
- Views
- 17K
- Replies
- 344
- Views
- 7K
- Replies
- 782
- Views
- 12K