Remove this Banner Ad

14,583

🥰 Love BigFooty? Join now for free.

Your graph is completely misleading because in 1991 the home game attendence figures are 40530. Try using one figure. I'll make a graph for you and see if you think it works for you. I know it won't, but it isn't really for you benefit. It is to show everyone the real picture. Stand by.

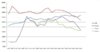
Its a 5 yr weighted moving average. It's designed to identify trends. And the Camry Crows trend is down, down, down,
 

Log in to remove this Banner Ad

Sorry for the late reply frantic day at work

I know this is hard for you grasp so I'll repeat myself a third time sydney is a small club with a small supporter base.

A base that doesn't grow very much but they stay think and thin, the fact that you want to compare crowds with the crows is the joke, if you had any balls you would admit that you wish you had the crows crowd numbers.

Hell I wish the swans had the crows crowd numbers but wishes are fishes we deal with what we have, I side with the crows on this because they are right your failure to keep fans on highlights your failure on and off the field.

Sydney never had those fans sure a few bandwagoners came after the flag but they left just a quickly.

We we're forcible relocated after over a half a decade of failure this tore apart our supporter base and then coupled with all the shit after we were relocated since then we have slowly been building that base back up in a city that barely knows we exist.

If you want to think your doing well to compare to our numbers go ahead it just highlights your minnow out look as a club nobody at Sydney is proud of our crowd figures note would we berate other teams for their figures.

I'm trying to show you, your delusional to be trying to put down the crowd numbers they are healthy and some of the strongest of any interstate team.

But since you want to bring my clubs numbers into this as some kinda of proof that your doing ok, the simple fact is you as you keep reminding everyone are the penultimate SANFL club, countless flags instant success when you came into the comp have been better then crows, you have more flags then Sydney in a city that loves AFL that is proud of the SANFL and yet you draw less then us?

Further more being this great powerful club that everyone respects you can't get sponsors the crows have had Toyota for years, the Swans have some of the most valued sponsors in league you still money from a ******* charity.

And yet you berate them for keeping a sponsor your so arsed backwards you insult a club for succeeding.

It seems every club wants to do better, north doesn't defend it's crowd figures nether do we, Melbourne doesn't defend it's on field failure. The western bulldogs aren't happy being in debt and inept richmond aren't content with not making finals.

But you lot can't even cop to your failure it's somebody else's fault let's blame everyone around us. then when corned you attack the very people highlighting the issues at your club.

Your ship is sinking, because of your non stop hounding of the crows. If for a second if you looked at fixing your own affairs looked at what make the crows successful and tried to replicate that perhaps you wouldn't be in such a dire state.

You can attack our crowds all you want but at least we are able to convince major sponsors that they are good enough to throw money at.

The crows know how to be successful in SA you lot do not you should be asking them for advice.

That is you would if you loved your club but it appears you just hate Adelaide, tell me is why you support port? Simply because you hate the crows? Do you actually care about port at all? Or is just about supporting a club that is a rival of the crows?

I went to a Sydney vs Richmond game on a Friday night in the early 90s once and there were only a few thousand people there. Back then you got a free ticket to the Swans when you bought a Whopper Meal at Hungry Jacks. A mate and myself decided we should try to introduce ourselves to everyone at the ground. We must of got up to about 1000 before we ended up in a corporate box and camped ourselves there for the rest of the night. Gee the Swans were woeful in the early 90s.

BTW 13,505.
 
From the figues below you will see Crows Home Game (Regular Season Games) averages for years 1991 to 2009 are all in the range 38248 - 46226. Even 2009 is not the lowest season average crowd until this point in time.

2010 and 2011 were horror years for the Crows. Have a look at the figures, then look at how the graph looks.

Two points of interest are 1) the Power's steady downward trend from inception. Look at the numbers and the graph. 2) The Swans have an overall increase in crowds from 1991. Make of this what you will.


Crowd figures 2 .JPG
 

Attachments

  • Crowd Graph 2.JPG
    Crowd Graph 2.JPG
    46 KB · Views: 25
Why are you guys discussing the Crows crowds when ours are up on last years and this thread is about Ports second lowest crowd ever?
 

Remove this Banner Ad

I went to a Sydney vs Richmond game on a Friday night in the early 90s once and there were only a few thousand people there. Back then you got a free ticket to the Swans when you bought a Whopper Meal at Hungry Jacks. A mate and myself decided we should try to introduce ourselves to everyone at the ground. We must of got up to about 1000 before we ended up in a corporate box and camped ourselves there for the rest of the night. Gee the Swans were woeful in the early 90s.

BTW 13,505.

It's like you don't read posts at all
 
From the figues below you will see Crows Home Game (Regular Season Games) averages for years 1991 to 2009 are all in the range 38248 - 46226. Even 2009 is not the lowest season average crowd until this point in time.

2010 and 2011 were horror years for the Crows. Have a look at the figures, then look at how the graph looks.

Two points of interest are 1) the Power's steady downward trend from inception. Look at the numbers and the graph. 2) The Swans have an overall increase in crowds from 1991. Make of this what you will.


View attachment 2123

Wow the Swans crowds have dropped a shitload since 2007. Thanks for pointing out how crap the top team has been. :thumbsu:
 
It's like you don't read posts at all

Did you know I've been a Swans member since 1994?

The Swans have over one million supporters (http://www.roymorgan.com/news/press-releases/2011/1424/index.cfm?printversion=yes), regularly rate over 250K on Sydney TV, are top of the table, play in either a 80K or 34K stadium, were technically insolvent last year, are averaging 22K this year and have had a 17K crowd against Brisbane and a 13K crowd against the Doggies.

The AFL have saved you a few times now. If the SANFL keep ****ing it up for us the AFL will have no choice but to take our licence from them and prop us up for a while too.
 

🥰 Love BigFooty? Join now for free.

Do you people realise this thread is more boring than watching paint dry??????

And I should know, having renovations done ... :mad:
 
The upshot is you can make a graph as misleading as you like. D_One has deliberately used methods to suit only his assertions with out looking at or presenting alternative methods.

Fact is Crows crowd average for regular season home games from 1991-2009 is 40975, not the 42K D_One is asserting. This years average is 36K and if GWS as an expansion team is discounted because they did not exist for previous years averages the figure is ~38K which is within the range seen from 1991-2009.

2010 and 2011 are the poor years because of bad results on field. The crowd recovery by the Crows is masked by the lower crowds expansion teams draw.

You don't have to accept what I have presented, but it is a hell of a lot more info than D_One has presented. He has presented partial data. Here is how he skews the figures.

1) He includes finals games which inflate the averages. In 1993 regular season: 46226, with finals 47050. This inflated average makes the recent 2 years look even worse in the graph because of a steeply dropping line.

2) He excludes Showdowns. This does little to drop the average of the years of good Crowds. But in years where crowds are down the Showdowns still pull big numbers. By excluding them he can have even lower figures for the recent years.

3) He uses a moving average which analyses the 5 periods, when if you want to work historically you need a longer term trend. You can pick which ever trend you want for the graph, but he chooses the one with the "worst looking line"

I'll put one up for you so you can see if you guys want to see it.

4)He chooses axis values on the y-axis that accentuate the drop. Here is one I prepared that is designed to hide the drop. I even kept the 5 year moving average that D_One uses. I could use this graph and say "See you are making it all up"
crowds 5yr ma Crows.JPG


As you can see he is clearly manipulating data and I stand by my claim that he is a charlatan and a fraud. I believe that this exposes him once and for all in his dodgy use of statistics and any future stats he provides should be treated as a troll. This is the Bay afterall.
 

Remove this Banner Ad

14,583

🥰 Love BigFooty? Join now for free.

Back
Top