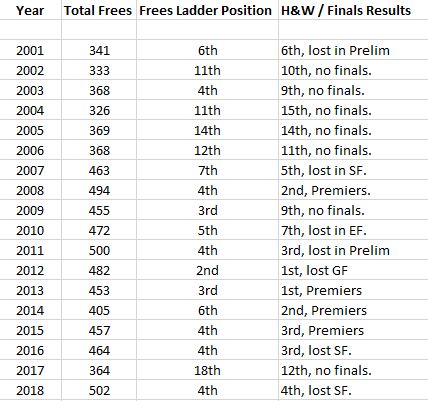
Frees for Ladder - Hawthorn 18th

Remove this Banner Ad

So what are these facts in black and white which will show those "plebs" the AFL conspiracy is true? Because if you actually look at the Frees for Ladder (the focus of this thread) over a long period of time it actually tells a different story. A story where our position on the free's for ladder seems to suspiciously match how well we are playing in a particular season. :think:

You can see for yourself here: https://www.afl.com.au/stats/stats-pro#/

k1auc2.jpg


I don't have the time or motivation to go through all teams in the same period but I wouldn't be surprised if this pattern is found across all teams. In fact from casual observation you do seem to notice the tops teams appearing higher up in most years.

I'm sure more could be gained by checking the frees against, the differential etc year by year, but again I neither have the time nor is this the focus of the thread.

So as far as frees for go, I think it's safe to keep the tin foil hat in the cupboard.
So is it cause... or effect? :think:
 
So is it cause... or effect? :think:

Good question.

I'm no expert but I'd hazard to guess it's due to the fact teams who are performing well in a season tend to be more disciplined and making more of the play (more possession etc) compared to lesser performing teams who are a little more under the pump having to chase more, under scoreboard pressure so more prone to make mistakes, have poorer skills (sloppy tackles etc). That's just my take on it but like I said I'm no expert.

As a side note, I found it interesting to see that the total free count went from around 300-350 in the early to mid 2000's, then jumped to a constant 400-450+ even topping 500 twice. Would be interesting to see if that's reflected across the whole competition but I'm not going to go into that detail.
 

Log in to remove this ad.

8-3 in the first quarter, here we go again...
not to mention the Breust bullshit play on call and the obvious throw that was used in the lead up to Saints first goal.
 
So what are these facts in black and white which will show those "plebs" the AFL conspiracy is true? Because if you actually look at the Frees for Ladder (the focus of this thread) over a long period of time it actually tells a different story. A story where our position on the free's for ladder seems to suspiciously match how well we are playing in a particular season. :think:

You can see for yourself here: https://www.afl.com.au/stats/stats-pro#/

k1auc2.jpg


I don't have the time or motivation to go through all teams in the same period but I wouldn't be surprised if this pattern is found across all teams. In fact from casual observation you do seem to notice the tops teams appearing higher up in most years.

I'm sure more could be gained by checking the frees against, the differential etc year by year, but again I neither have the time nor is this the focus of the thread.

So as far as frees for go, I think it's safe to keep the tin foil hat in the cupboard.


is this table frees for and against or just frees for???....if its just frees for its useless
 
is this table frees for and against or just frees for???....if its just frees for its useless

As I said in my post, it's just the frees for which is the topic of this thread.

Yes on it's own it is useless but I was simply using it to counter the assertion that the current stats for 2019 showed the anti Hawthorn bias in "black and white".
 
So what are these facts in black and white which will show those "plebs" the AFL conspiracy is true? Because if you actually look at the Frees for Ladder (the focus of this thread) over a long period of time it actually tells a different story. A story where our position on the free's for ladder seems to suspiciously match how well we are playing in a particular season. :think:

You can see for yourself here: https://www.afl.com.au/stats/stats-pro#/

k1auc2.jpg


I don't have the time or motivation to go through all teams in the same period but I wouldn't be surprised if this pattern is found across all teams. In fact from casual observation you do seem to notice the tops teams appearing higher up in most years.

I'm sure more could be gained by checking the frees against, the differential etc year by year, but again I neither have the time nor is this the focus of the thread.

So as far as frees for go, I think it's safe to keep the tin foil hat in the cupboard.
This is actually the reverse of the historical trend. If you look at the 70's we were by far the worst team in terms of giving away free kicks and receiving them.
It seems the trend is the more free kicks you are involved with the better you perform.
 

Remove this Banner Ad

Back
Top