

FootyMaths
Debutant
- Jul 4, 2012
- 83
- 30
- AFL Club
- GWS
Follow along with the video below to see how to install our site as a web app on your home screen.
Note: This feature may not be available in some browsers.

Due to a number of factors, support for the current BigFooty mobile app has been discontinued. Your BigFooty login will no longer work on the Tapatalk or the BigFooty App - which is based on Tapatalk.
Apologies for any inconvenience. We will try to find a replacement.


You should print out A3 sized posters of this squiggle and sell it outside the ground to fans of the premiers after the game.2015 Premiers: Hawthorn
I'm thinking of something more akin to a squiggle-like lavalamp.You should print out A3 sized posters of this squiggle and sell it outside the ground to fans of the premiers after the game.
Log in to remove this Banner Ad
It's weird how far away this years cup is from the other 2
Great point. I checked! Here it what it looks like if we exclude games involving Fitzroy, Gold Coast, and GWS:

This probably over-penalizes those years a little, since now those finalists have fewer games with which to earn squiggle points. But yes, this is probably a better way to look at it.
Different years definitely have different shape. Compare 2003 to 2015 at the end of the H&A season:

It is all relative, so you could argue that in 2003 everyone was actually really competitive. But certainly there's a much clearer separation between strong and weak teams this year than in the past.
Still giggling at thisI hate my football club
The Frawley factor - with Gibson (25) and Lake (22) playing most of the season also helping.Similar attack but better defence.
The Frawley factor - with Gibson (25) and Lake (22) playing most of the season also helping.
That ain't Ted, he's at TedSport.com.au and picked an 11pt margin for HawthornJust found another: Ted Hopkins beats as all with a Hawks by 20 tip
Yes your right... I completely fruited that up, looked at the wrong link and text from a blog post of mine from last year. The Hawks-20 was Robert from AFL Predictions.That ain't Ted, he's at TedSport.com.au and picked an 11pt margin for Hawthorn
I like how the Suns are hiding. Barring another horror season of injuries, I'd like to think they could get to about where Geelong are starting.It's never too early to look ahead to next year!
This is generated from 2015 results only, with all teams beginning at 50/50. The only difference to the regular squiggle is that 2014 data has been dropped.
The squiggle cares not for trades, drafts, retirements and pre-seasons, so these positions will remain as they are going into Round 1, 2016.
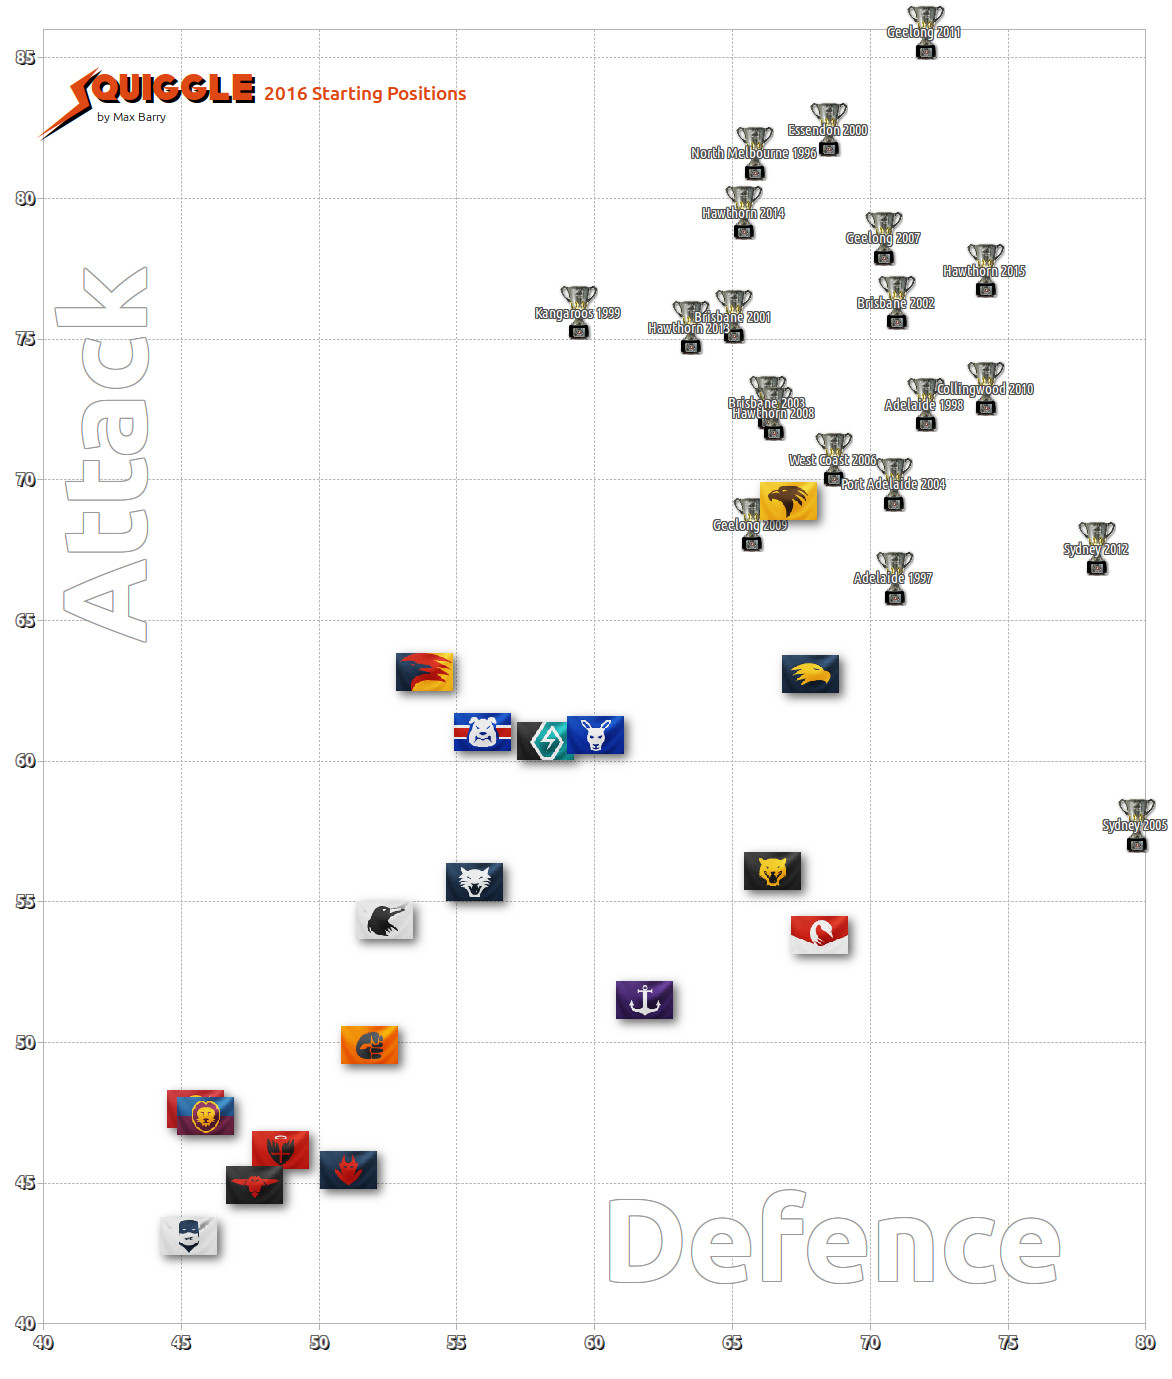
It's never too early to look ahead to next year!
This is generated from 2015 results only, with all teams beginning at 50/50. The only difference to the regular squiggle is that 2014 data has been dropped.
The squiggle cares not for trades, drafts, retirements and pre-seasons, so these positions will remain as they are going into Round 1, 2016.
Yep. Fremantle had a terrific first 9 rounds, then became seriously average.So according to the 2016 Squiggle starting position Fremantle is only the 9th (or even 10th) best team?
Amazing.
The collective heart of Richmond fans just broke again.Yep. Fremantle had a terrific first 9 rounds, then became seriously average.
This is the ladder if the season started in Round 10:
# | Team | W | L | D | Pts | % \ 1. | HAWTHORN | 11 | 2 | 0 | 44 | 163.4% \ 2. | RICHMOND | 10 | 3 | 0 | 40 | 134.6% \ 3. | WEST COAST | 9 | 3 | 1 | 38 | 139.7% \ 4. | WESTERN BULLDOGS | 9 | 4 | 0 | 36 | 126.0% \ 5. | SYDNEY | 9 | 4 | 0 | 36 | 122.6% \ 6. | NORTH MELBOURNE | 9 | 4 | 0 | 36 | 120.5% \ 7. | ADELAIDE | 8 | 4 | 1 | 34 | 117.3% \ 8. | PORT ADELAIDE | 8 | 5 | 0 | 32 | 114.6% \ 9. | Geelong | 7 | 4 | 2 | 32 | 110.6% \ 10. | Fremantle | 8 | 5 | 0 | 32 | 100.5% \ 11. | Greater Western Sydney | 5 | 8 | 0 | 20 | 91.3% \ 12. | Collingwood | 4 | 9 | 0 | 16 | 93.3% \ 13. | Melbourne | 4 | 9 | 0 | 16 | 80.9% \ 14. | Gold Coast | 3 | 9 | 1 | 14 | 77.3% \ 15. | St Kilda | 3 | 9 | 1 | 14 | 75.7% \ 16. | Carlton | 3 | 10 | 0 | 12 | 66.0% \ 17. | Brisbane Lions | 2 | 11 | 0 | 8 | 68.0% \ 18. | Essendon | 2 | 11 | 0 | 8 | 61.3%
The collective heart of Richmond fans just broke again.

Just to clarify, results from early in the season carry less weight on the squiggle than later in the season?Yep. Fremantle had a terrific first 9 rounds, then became seriously average.
This is the ladder if the season started in Round 10:
# | Team | W | L | D | Pts | % \ 1. | HAWTHORN | 11 | 2 | 0 | 44 | 163.4% \ 2. | RICHMOND | 10 | 3 | 0 | 40 | 134.6% \ 3. | WEST COAST | 9 | 3 | 1 | 38 | 139.7% \ 4. | WESTERN BULLDOGS | 9 | 4 | 0 | 36 | 126.0% \ 5. | SYDNEY | 9 | 4 | 0 | 36 | 122.6% \ 6. | NORTH MELBOURNE | 9 | 4 | 0 | 36 | 120.5% \ 7. | ADELAIDE | 8 | 4 | 1 | 34 | 117.3% \ 8. | PORT ADELAIDE | 8 | 5 | 0 | 32 | 114.6% \ 9. | Geelong | 7 | 4 | 2 | 32 | 110.6% \ 10. | Fremantle | 8 | 5 | 0 | 32 | 100.5% \ 11. | Greater Western Sydney | 5 | 8 | 0 | 20 | 91.3% \ 12. | Collingwood | 4 | 9 | 0 | 16 | 93.3% \ 13. | Melbourne | 4 | 9 | 0 | 16 | 80.9% \ 14. | Gold Coast | 3 | 9 | 1 | 14 | 77.3% \ 15. | St Kilda | 3 | 9 | 1 | 14 | 75.7% \ 16. | Carlton | 3 | 10 | 0 | 12 | 66.0% \ 17. | Brisbane Lions | 2 | 11 | 0 | 8 | 68.0% \ 18. | Essendon | 2 | 11 | 0 | 8 | 61.3%
Final Siren, regarding the debate over which 21st-century dynasty is best (Lions, Cats, Hawks), can the Squiggle shed any light at all in settling that debate? I'm aware that the dynamics of each season are quite different.2015 Premiers: Hawthorn
Animated!
Pretty emphatic from the Hawks (again), and an incredibly disappointing performance from the Eagles. Their score of 61 points (including junk time goals!) was only a little higher than their average winning margin this year.
Final Flagpole! Provided for Hawk fans to enjoy:
I'll be back to do the straight-line chart and the 2016 starting positions chart. In the meantime, thank you for following Squiggles 2015! As always, may your off-season be brief, your trades foresighted, and your spuds delisted.
Live squiggling
Right, because a new match forms 9% of a team's squiggle position, which means all the previous matches have to contribute 9% less than they did before. Like this:Just to clarify, results from early in the season carry less weight on the squiggle than later in the season?
The "91" in ISTATE-91:12 means that each round, 91% of a team's position is dictated by previous matches and 9% by the new match. (The "12" is for 12 points of home game advantage.) This works as a weighted average like this:
I use these values because I just let my system run simulations of every possible combination of values (ISTATE-99:0, ISTATE-99:1...) for the last 5, 10, 15, 20, 25, and 30 years, and these ones came out best.Game Recency | Weighting \ 1 | 9% \ 2 | 8.2% (9% x 91%) \ 3 | 7.5% (9% x 91% x 91%) \ 4 | 6.8% \ 5 | 6.2% \ 6 | 5.6% \ 7 | 5.1% \ 8 | 4.7% \ 9 | 4.2% \ 10 | 3.9% \ 11 | 3.5% \ ... | ... \ 22 | 1.2% \ 23 | 1.1% \ 24 | 1.0% \ ... | ... \ 30 | 0.6% \ 31 | 0.5% \ ... | ...
Since there's not always 30+ games of previous data -- like at the start of a year, when teams are reset with only the previous season's results -- the default 50/50 starting position can hold quite a lot of weight, too. If you add up all the percentages for games 1-22, you get 87.4%, meaning there's 12.6% left for the default 50/50 position. This has the effect of dragging all teams back towards 50/50 at the start of a season, then letting them spread out as each new game reduces the weighting of the default starting position.
More info: here -> Info -> Model.
Hmm! Well one way of rating it would be to consider how much better the dynastic team was over their three seasons of dominance than their leading challengers.Final Siren, regarding the debate over which 21st-century dynasty is best (Lions, Cats, Hawks), can the Squiggle shed any light at all in settling that debate? I'm aware that the dynamics of each season are quite different.
Why does the fact GWS and Gold Coast were particularly poor sides in their first few years matter?Hmm! Well one way of rating it would be to consider how much better the dynastic team was over their three seasons of dominance than their leading challengers.
This means we rate teams that spent the whole year looking like champions, rather than teams that only peaked at the end.
We probably don't want to compare them to the season average, since that gets skewed by particularly bad teams (and 2013 had two terrible ones). So let's compare the eventual premier to the other seven finalists. That's still subject to skewing by years with unusually poor/strong finalists, but not as badly, and you have to draw the line somewhere.
We'll also smoosh Geelong's three premiership years together as if they were a three-peat. This either gives the Cats too much credit, since they couldn't pull that off in reality, or undersells them, since their dynasty was actually over a longer period, whichever way you want to look at it.
This gives us:
#1 Brisbane 2002
15.3% better than opposition finalists over the course of the year, with only Port (midyear) and Collingwood (late) providing any sort of challenge.
#2 Hawthorn 2015
13.3% better. Never headed but a year with a particularly strong top 8.
#3 Geelong 2011
9.7% better. Played second fiddle to Collingwood for most of the year, but still a lot better than the average finalist.
#4 Hawthorn 2014
9.3% better. Spent the whole year either at #1 or very close to it, but with credible competition from Sydney, Fremantle, and Port.
#5 Brisbane 2003
9.1% better. Always threatening, but never got too far away from Port and Collingwood.
#6 Geelong 2007
9.1% better. Started the year a long way back before going a long way ahead. A season that is done a disservice by averages.
#7 Geelong 2009
8.5% better. Consistently threatening all year, but often behind St Kilda, with late challenges from the Bulldogs and Adelaide.
#8 Hawthorn 2013
8.0% better. One of four strong challengers with Sydney, Geelong, and Fremantle.
#9 Brisbane 2001
4.2% better. Trailed Essendon for almost the whole year and really only got going mid-season.
If you average the three years:
10.2% Hawthorn
9.5% Brisbane
9.1% Geelong
This of course is just according to the particular criteria I've invented here. "Best dynasty" is subjective, so no-one will agree on what it means.
Statistically speaking they drag the averages of the league down. It's not like you're adding a league-average team to the competition (which it would be fine to keep them in), rather, you're adding a team which makes the pre-existing clubs seem better than they are, relative to the teams of previous years.Why does the fact GWS and Gold Coast were particularly poor sides in their first few years matter?
Doesn't the squiggle account for this by making it so teams have to utterly demolish them to get the same movement that you'd get from simply beating a good side by a decent margin?
The only sides that would really benefit from them were the ones who played them early before the Squiggle knew it shouldn't rate them.