Stat Observations

Remove this Banner Ad

Unfortunately it's one of those things where revealing the trick would get it shut down
Shame. I know there are things out there that basically scrape afl tables and give you some tools for working with it but yes, you definitely seem to have some things in excess of that. A few years ago I had a poke around and found some json describing the game events on one of those animated play trackers.
 

Log in to remove this ad.

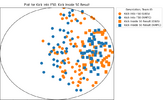
Kicks into Forward 50 and their result (NMFC vs GWS, R1).

It seems that we weren't able to penetrate the half forward line as well and weren't able to get the ball as deep.

1710653638961.png
 
Kicks into Forward 50 and their result (NMFC vs GWS, R1).

It seems that we weren't able to penetrate the half forward line as well and weren't able to get the ball as deep.

View attachment 1930739
Great plot.

It illustrates the issues with our long entries into f50 i think. But how much pressure were we under in the middle because imo those long entries are as much a function of pressure as anything else.
 
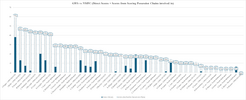
We kicked the ball 205 times, the difference between first and almost last for ball retention is 6% or approximately 12 kicks a game.
That's 3 kicks a quarter. Amazing the difference by correcting 3 kicks a quarter could make to our overall game result.
 
A very early prototype of something I'm working on...
received_367595132857160.png

Hopefully something exciting to share in the coming weeks
 
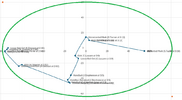
Inside 50 kicks/marks that resulted in goals from North Melbourne vs Brisbane (R4)
1712329614545.png
(normalised kicking-ends)
 
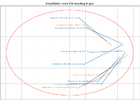
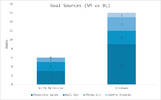
Goal sources
1712329854562.png

9/16 (56%) of Brisbane's goals came from Possession Gains (turnovers from North).

North didn't manage to score a goal from a Brisbane turnover even once. A bit of an indictment on our pressure forwards, would love to hear any theories as to why from those who caught more of the game.
 

(Log in to remove this ad.)

Would love your data source Engimal if you could share on DM?

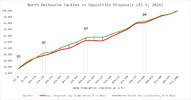
Anyway, I was wondering how far ahead on the 50m penalty ladder we are, and found the data on the Fox footy site. No surprises here.

ADE - 5
BRI - 3
CAR - 2
COL - 2
ESS - 3
FRE - 6
GEE - 3
GCS - 3
GWS - 5
HAW - 4
MEL - 3
NTH - 10
POR - 3
RIC - 8
STK - 0
SYD - 4
WCE - 5
WBD - 3
 
Goal sources
View attachment 1951186

9/16 (56%) of Brisbane's goals came from Possession Gains (turnovers from North).

North didn't manage to score a goal from a Brisbane turnover even once. A bit of an indictment on our pressure forwards, would love to hear any theories as to why from those who caught more of the game.
Love all of these, by the way. Some really interesting stuff.

Question on this one: what were the turnovers? Were they free kicks against, ball spills out in a tackle, intercepted kick, etc, etc?
 
Rucks over 3 matches or more thus far:
View attachment 1954810
All looks about right. Hit outs to advantage not nearly high enough, pressure acts and clearances sky high, and a pretty shizen score involvement percentage because the clearances we get aren't too clean (just like our forward entries).
 
Love all of these, by the way. Some really interesting stuff.

Question on this one: what were the turnovers? Were they free kicks against, ball spills out in a tackle, intercepted kick, etc, etc?

Sorry, didn't see this. Unfortunately I got stoned as in my garage after making this and didn't save it. I'll look into it though!
 
Here's an observation.

We on average are allowing the opposition to have 32 scoring shots per match. 8 per quarter.
We average 14 scoring shots per game or if your prefer 3.5 per quarter
The 'against' average per match is currently 122. Or 18.14 122.
We average a "stern look" 10.9 69
If you deep dive into that it actually means our back line is ****ed, our mid field is ****ed and our Fwd line is ****ed.

Going by that, beating anyone would be amazing.

Oh well
When I read that I heard Lou Richards reading the scores :cool:
 
Here's an observation.

We on average are allowing the opposition to have 32 scoring shots per match. 8 per quarter.
We average 14 scoring shots per game or if your prefer 3.5 per quarter
The 'against' average per match is currently 122. Or 18.14 122.
We average a "stern look" 10.9 69
If you deep dive into that it actually means our back line is ****ed, our mid field is ****ed and our Fwd line is ****ed.

Going by that, beating anyone would be amazing.

Oh well
We're crap and our opponents are good.

That's exactly the type of meaningless hot take you've become known for, TAO. Great stuff.
 

Remove this Banner Ad

Back
Top