


JHF1870
Premium Platinum
- Sep 19, 2007
- 20,242
- 14,793
- AFL Club
- Port Adelaide
What are the top 10 consecutive losing and winning margins
Follow along with the video below to see how to install our site as a web app on your home screen.
Note: This feature may not be available in some browsers.

Due to a number of factors, support for the current BigFooty mobile app has been discontinued. Your BigFooty login will no longer work on the Tapatalk or the BigFooty App - which is based on Tapatalk.
Apologies for any inconvenience. We will try to find a replacement.
1. In Round 15, 2000 both Brisbane Lions and Melbourne had victories by a margin of 69 points. Is this the largest margin to be recorded twice in one round?
2. In Round 19, 1986 Footscray lost to North Melbourne by 57 points. The following week they defeated Melbourne by 57 points. Is this the largest number to be recorded as both a winning and losing margin in successive games by one team?
| Margin | Year | Round |
|---|---|---|
106 | 1944 | 17 |
97 | 1987 | 17 |
82 | 2010 | 17 |
75 | 1992 | 19 |
74 | 2004 | 11 |
72 | 1995 | 8 |
69 | 2000 | 15 |
68 | 1970 | 15 |
67 | 2012 | 6 |
67 | 2017 | 16 |
| Margin | Year | Rounds | Club | Result 1 | Result 2 |
|---|---|---|---|---|---|
76 | 1989 | 22 & QF | Geel | W | L |
72 | 1971 | 21 & 22 | Syd | L | W |
71 | 1995 | 10 & 11 | Frem | W | L |
63 | 1990 | SF & PF | Ess | L | W |
62 | 1920 | 14 & 15 | Melb | W | L |
59 | 1963 | 1 & 2 | Geel | W | L |
57 | 1986 | 19 & 20 | W.B. | L | W |
57 | 2000 | 16 & 17 | Haw | W | L |
56 | 1979 | 12 & 13 | Rich | W | L |
52 | 2015 | 17 & 18 | Syd | L | W |
Log in to remove this Banner Ad
What are the top 10 consecutive losing and winning margins
What's the most consecutive games from debut a player's achieved a personal best with highest winning margins?
You can see the answer here: AFL Tables - Game RecordsWhat is the lowest team score in VFL/AFL history when a team scored the same number of points in each half?
What's the most consecutive games from debut a player's achieved a personal best with highest winning margins?
How many times have the top 5 goalkickers all had 10 goals or over after 3 rounds?
and
How many times has the Coleman leader had 17 goals to his name after 3 rounds?
What are the top 10 consecutive losing and winning margins
| Margin | Club | Year | Rounds | Opponents |
| 87 | Carl | 1987 | 3,4 | W.B./W.C. |
| 74 | Adel | 1998 | 19,20 | P.A./Geel |
| 70 | Coll | 1973 | 3,4 | Geel/St.K |
| 68 | Carl | 1987 | 19,20 | Syd/Geel |
| 57 | Bris | 2002 | 6,7 | Geel/P.A. |
| 54 | Rich | 1939 | 13,14 | W.B./Ess |
| 54 | N.M. | 2012 | 18,19 | Melb/W.B. |
| 52 | Coll | 1919 | 11,12 | St.K/Geel |
| 51 | Carl | 1909 | 14,15 | Melb/Fitz |
| 50 | N.M. | 1979 | 4,5 | Geel/Syd |
| 49 | Syd | 1930 | 7,8 | Haw/W.B. |
| Margin | Club | Year | Rounds | Opponents |
| 104 | Frem | 2017 | 21,22 | Syd/Rich |
| 101 | Bris | 1991 | 19,20 | Geel/Coll |
| 92 | Syd | 1993 | 15,17 | Coll/Haw |
| 86 | Haw | 2017 | 3,4 | G.C./Geel |
| 76 | Syd | 1972-73 | 22,1 | Rich/Coll |
| 75 | Haw | 1950 | 11,12 | N.M./Geel |
| 74 | Ess | 2011 | 18,19 | Carl/Coll |
| 64 | St.K | 1984 | 9,10 | Rich/Fitz |
| 63 | Melb | 1997 | 13,14 | Haw/Ess |
| 63 | Ess | 2007 | 18,19 | Haw/Frem |
| 63 | Rich | 2008 | 18,19 | Geel/Adel |
Oh, sorry, I worked it out for the last 10 years manually. There must be a quicker way of doing it but I don't have a database. I meant cumulative total points for consecutive losses or wins.I've taken this to mean the same margin in consecutive games by the same club
Wins
Margin Club Year Rounds Opponents 87 Carl 1987 3,4 W.B./W.C. 74 Adel 1998 19,20 P.A./Geel 70 Coll 1973 3,4 Geel/St.K 68 Carl 1987 19,20 Syd/Geel 57 Bris 2002 6,7 Geel/P.A. 54 Rich 1939 13,14 W.B./Ess 54 N.M. 2012 18,19 Melb/W.B. 52 Coll 1919 11,12 St.K/Geel 51 Carl 1909 14,15 Melb/Fitz 50 N.M. 1979 4,5 Geel/Syd 49 Syd 1930 7,8 Haw/W.B.
Losses
Margin Club Year Rounds Opponents 104 Frem 2017 21,22 Syd/Rich 101 Bris 1991 19,20 Geel/Coll 92 Syd 1993 15,17 Coll/Haw 86 Haw 2017 3,4 G.C./Geel 76 Syd 1972-73 22,1 Rich/Coll 75 Haw 1950 11,12 N.M./Geel 74 Ess 2011 18,19 Carl/Coll 64 St.K 1984 9,10 Rich/Fitz 63 Melb 1997 13,14 Haw/Ess 63 Ess 2007 18,19 Haw/Frem 63 Rich 2008 18,19 Geel/Adel

Thanks Ron The Beara) 73 times. In 1939 the top 14 all had 10+.
b) After three rounds, leading goalkicker:
> 17 goals, 37 times (most 33 Bob Pratt 1934)
= 17 goals, 10 times
< 17 goals, 78 times (least 7 1897,1900,1901,1902,1918)
Oh, sorry, I worked it out for the last 10 years manually. There must be a quicker way of doing it but I don't have a database. I meant cumulative total points for consecutive losses or wins.
| Combined Margins | Club | Start Yr | Rd |
| +1038 | Ess | 2000 | 1 |
| +944 | Ess | 2000 | 2 |
| +914 | Geel | 2008 | 10 |
| +901 | Ess | 2000 | 3 |
| +865 | Ess | 2000 | 4 |
| +858 | Geel | 2008 | 11 |
| +845 | Geel | 2008 | 12 |
| +838 | Coll | 1928 | SF |
| +834 | Coll | 1928 | GF |
| +830 | Bris | 2001 | 10 |
| Combined Margins | Club | Start Yr | Rd |
-2599 | St.K | 1897 | 1 |
-2574 | St.K | 1897 | 2 |
-2534 | St.K | 1897 | 3 |
-2477 | St.K | 1897 | 4 |
-2447 | St.K | 1897 | 5 |
-2410 | St.K | 1897 | 6 |
-2399 | St.K | 1897 | 7 |
-2316 | St.K | 1897 | 8 |
-2292 | St.K | 1897 | 9 |
-2235 | St.K | 1897 | 10 |
| Combined Margins | Club | Start Yr | Rd |
903 | GWS | 2012 | 8 |
885 | GWS | 2012 | 13 |
845 | GWS | 2012 | 9 |
835 | GWS | 2012 | 14 |
810 | GWS | 2012 | 7 |
809 | GWS | 2012 | 10 |
804 | GWS | 2013 | 6 |
804 | GWS | 2013 | 7 |
792 | Fitz | 1996 | 13 |
782 | GWS | 2012 | 6 |
| Combined Margins | Club | Start Yr | Rd |
| +721 | Haw | 2012 | 10 |
| +699 | Geel | 2008 | 13 |
| +685 | Geel | 1992 | 3 |
| +674 | Geel | 1989 | 7 |
| +670 | Haw | 2012 | 11 |
| +669 | Geel | 1989 | 6 |
| +659 | Geel | 2008 | 12 |
| +656 | Geel | 2008 | 10 |
| +653 | Geel | 1989 | 2 |
| +646 | Coll | 2011 | 10 |
| … | |||
| -764 | Fitz | 1995 | 13 |
| -767 | GWS | 2012 | 14 |
| -770 | N.M. | 1930 | 11 |
| -775 | N.M. | 1930 | 12 |
| -777 | GWS | 2012 | 9 |
| -792 | Fitz | 1996 | 13 |
| -804 | GWS | 2013 | 7 |
| -804 | GWS | 2013 | 6 |
| -817 | GWS | 2012 | 13 |
| -903 | GWS | 2012 | 8 |
| Combined Margins | Club | Start Yr | Rd |
| +787 | Haw | 2012 | 10 |
| +779 | Haw | 2012 | 8 |
| +776 | Geel | 1988 | 18 |
| +775 | Geel | 1992 | 3 |
| +773 | Haw | 2012 | 7 |
| +769 | Geel | 1988 | 21 |
| +674 | Geel | 1988 | 19 |
| +756 | Geel | 1988 | 17 |
| +743 | Geel | 1991 | 19 |
| +739 | Geel | 1989 | 2 |
| Combined Margins | Club | Start Yr | Rd |
-903 | GWS | 2012 | 8 |
-879 | GWS | 2012 | 13 |
-863 | GWS | 2012 | 12 |
-850 | GWS | 2012 | 6 |
-841 | GWS | 2012 | 9 |
-831 | GWS | 2012 | 14 |
-811 | Fitz | 1996 | 4 |
-804 | GWS | 2013 | 6 |
-804 | GWS | 2013 | 7 |
-800 | GWS | 2012 | 10 |
I would like to know when ( and 5 rounds is a decent number ) Footscray and Melb were sitting 1 and 2 on the ladder if ever and both unbeaten as well
Couple of guesses - and it is a long time ago 1961 - i know for a fact Foot and Geel played in the last game - and the winner ( Foot ) got 4th spot and the loser missed the 4 - and the other guess would be 1954 because Footscray beat Melb in the GF
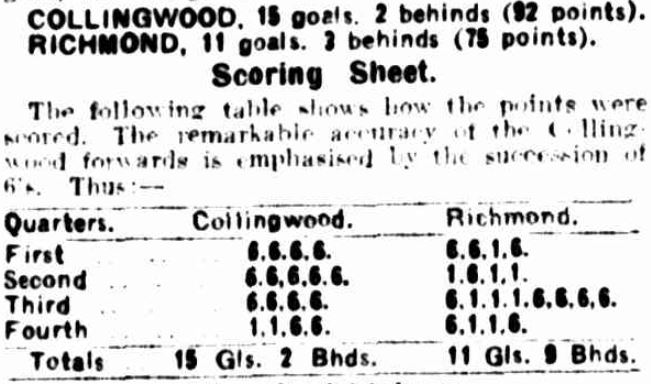
Have to ask, what's the most consecutive goals scored by a side before registering their first behind? Crows 14.0.84 at half time today against the Hawks.
I did check that. The 2 behinds came before the goals, so the run ended on 13 straight.Could be a record.
Collingwood scored 13.0 at 3qtr time in R1 1929 before scoring 2 goals and 2 behinds in the final quarter. But we don't know the order of those Q4 scores.
 trove.nla.gov.au

I did check that. The 2 behinds came before the goals, so the run ended on 13 straight. Adelaide's effort has been described as a record: AFL round 6: Tom Lynch medical substitution, Adelaide Crows vs Hawthorn Hawks score (news.com.au)
View attachment 1112205
Could be a record.
Collingwood scored 13.0 at 3qtr time in R1 1929 before scoring 2 goals and 2 behinds in the final quarter. But we don't know the order of those Q4 scores.
 trove.nla.gov.au