Analysis The Adelaide Crows Stats Thread

Remove this Banner Ad

OP UPDATED POST RD 7
Some interesting team stats;
  • Our scoring ratio to i50s increased from 44.25% to 45.72% this week, compared to our direct opponents decreasing from 44.96% to 44.31%.
Some interesting player stats;
  • Of our top 10 in disposal efficiency, 8 are defenders. Only M. Crouch and Sauce are considered other than defenders (yes, I'm counting Mackay as a defender).
  • Danger is our chief tackler this year having recorded 9 more tackles than our next best in VB.
 
Snake lever - 133m from 15 this week. 8.5m a touch. Better but still want more.

Hendo...530m from 23 touches. 23m per touch. This is why he is in the side.

Griggy, going at 24m on average on sat. 461m from 19. Love it.

Danger only 6 score involvements id prefer was different
 
Snake lever - 133m from 15 this week. 8.5m a touch. Better but still want more.

Hendo...530m from 23 touches. 23m per touch. This is why he is in the side.

Griggy, going at 24m on average on sat. 461m from 19. Love it.

Danger only 6 score involvements id prefer was different
What was Mackay's metres gained?
 

Log in to remove this ad.

Whipping boy performance count update for R7

Player|Metric|Season Amount|This Week|Average Per Game
\Josh "Goose" Jenkins| Contested Marks|2|0 (Injured)|0.4
\David "$400,000" Mackay| Below Average Disposal Games|4|0|17.2
\Matthew "Small Forward" Wright| Goals|0|0|0.0
\Kyle "Clanger" Hartigan | Clangers|7|0 (Suspended)|1.75
\Nathan "Cooler" Van Berlo| Possessions|98|16|14
\Ricky "Footsteps" Henderson| Tackles|8|2|1.3

Struggling to figure out what Wright actually does in the forward line. He's had no goals, and no behinds, in 7 games. And only 5 goal assists.

Mackay looking most likely to break away from the whipping boy tag

Can you please add a "games played" column, so i don't have to math.

And Wright provides "Synergy"
 
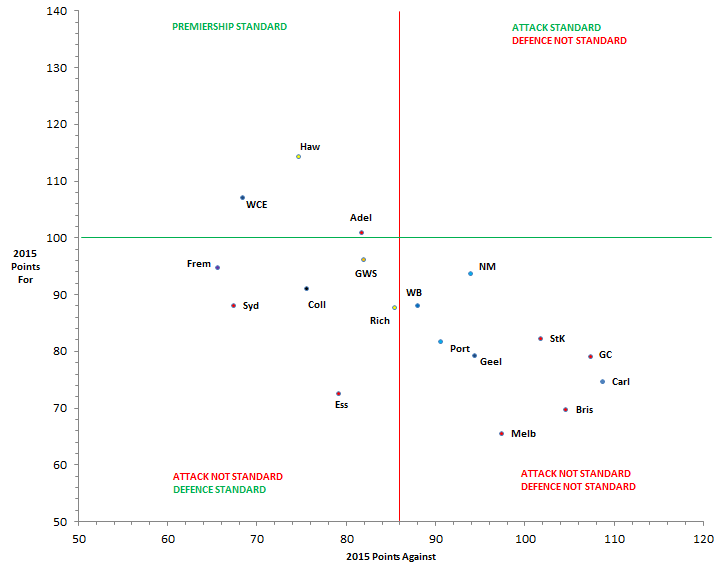
CFgRamIVEAEjRgl.png:large

Our window is ajar ;)
 
Is that based off a number of years premiers? Or does it include top 4 teams each year?
It's Champion Data's graph. I'm trying to locate the original tweet about it.

Edit:
2015 Points For/Against - 14 of last 15 premiers 100+ FOR - 14 of last 15 premiers <86 AGAINST
 
It's Champion Data's graph. I'm trying to locate the original tweet about it.

Edit:
2015 Points For/Against - 14 of last 15 premiers 100+ FOR - 14 of last 15 premiers <86 AGAINST
Had a quick look at top 4 from past 15 years.
Average for 105.5, average against 81.6.
 
Can you please add a "games played" column, so i don't have to math.

And Wright provides "Synergy"

The great support for Wrighty from Phil and the coaches reminds me of the criticism of Kenny "the Gun" McGregor in his later years. A Crow's spokesman (possible Harper) said that Kenny was playing a valuable role for the team and the general fan did not appreciate what he was doing. When asked "Well, what is Ken's role?" his answer was " It's Ken's role to be where the ball isn't".

I thought at the time how close I came to being an AFL footballer since I was usually where the ball wasn't :D.
 

(Log in to remove this ad.)

I wonder if people's perceptions of players and their value to a team can be related to the rise of fantasy and supercoach etc? If players don't get the stats and a higher rating then they are not considered 'valuable' or under performing. The coach isn't interested in those ratings. They are interested in the actual role and performance they are doing for the team and under instruction.

I suppose this relates to my distrust of those sorts of stats and rating systems. Some stats are useful and can tell us some information, but I think they need to always be balanced up against other measures.

While standard stats are limited, there is a wider metric for everything. Blocks, spoils, meters gained, goal assists, pressure. I'm sure the coaches look at some of these, along with positioning, to determine whether they are performing their role correctly.

In the case of Wright, most of his metrics must be in one of these lesser mentioned areas. I imagine it's blocks, goal assists and scoring chains. However it just doesn't look like he's doing all that much on the ground, and I suspect the coaches haven't been hugely happy with him in some games (hence why he has been the sub/subbed on a few occasions)
 
Not sure if we want or need this, but seeing as I'm the self proclaimed Statman, I decided to do it anyway. I'll update our stats every week.

Some interesting team stats;
  • Our scoring ratio to i50s increased from 44.25% to 45.72% this week, compared to our direct opponents decreasing from 44.96% to 44.31%.
Crows Stats| Total| Average| Rank| Compare To Mean| Compare To Opp| Opp Total| Opp Average
\Kicks| 1600| 228.6| 2| +23.3| +31.6| 1379| 197|
\Handballs| 1024| 146.3| 15| -11.5| -12.9| 1114| 159.1|
\Kick-Handball Ratio| 1.6| | 1| +0.3| +0.3| 1.2| |
\Disposals| 2624| 374.9| 7| +11.9| +18.7| 2493| 356.1|
\Cont Poss| 994| 142| 4| +3.2| +4.7| 961| 137.3|
\Uncont Poss| 1605| 229.3| 10| +6.4| +15.4| 1497| 213.9|
\Disp eff %| 70.6%| | 15| -1.9| +0.9| 69.7%| |
\Clangers| 351| 50.1| 15| +2.8| +3.3| 328| 46.9|
\Marks| 722| 103.1| 3| +15.4| +20.3| 580| 82.9|
\Cont marks| 66| 9.4| 10| -0.4| -2.1| 81| 11.6|
\Marks50| 99| 14.1| 3| +3.8| +4.1| 70| 10|
\Hit-outs| 299| 42.7| 8| +1.1| +0.3| 297| 42.4|
\Clearances| 301| 43| 3| +4.2| +9.7| 233| 33.3|
\Centre clr| 102| 14.6| 3| +2.1| +2.7| 83| 11.9|
\Stoppages| 199| 28.4| 4| +2.1| +7| 150| 21.4|
\Rebound50| 247| 35.3| 14| -3.4| -3.4| 271| 38.7|
\Frees For| 115| 16.4| 16| -3| -0.7| 120| 17.1|
\Frees Agst| 120| 17.1| 4| -2.2| +0.7| 115| 16.4|
\Tackles| 478| 68.3| 8| +3.8| +3.4| 454| 64.9|
\One %s| 290| 41.4| 13| -2.8| -1.6| 301| 43|
\Bounces| 59| 8.4| 8| -0.4| -1.6| 70| 10|
\Inside50| 409| 58.4| 2| +6.8| +10.7| 334| 47.7|
\Goals| 104| 14.9| 3| +2.5| +3.1| 82| 11.7|
\Behinds| 83| 11.9| 7| +0.6| +2.4| 66| 9.4|
\Total Score| 707| 101| 3| +15.5| +42.1| 412| 58.9|
\Rushed Behinds| 17| 2.4|
\Goal assists| 75| 10.7| 3| +2.1| +3.9| 48| 6.9|
\Goal acc %| 55.6%| | 3| +3.3| +0.2| 55.4%| |
\Goal acc % excl rushed| 61.2%|
\Interchanges| 762| 108.9| 8| +3.2| | | |

Some interesting player stats;
  • Of our top 10 in disposal efficiency, 8 are defenders. Only M. Crouch and Sauce are considered other than defenders (yes, I'm counting Mackay as a defender).
  • Danger is our chief tackler this year having recorded 9 more tackles than our next best in VB.
Rank| Kicks |#| Handballs |#| Disposals |#| Cont Poss |#
\1| Matthew Jaensch |110| Scott Thompson |82| Patrick Dangerfield |166| Patrick Dangerfield |91|
\2| Patrick Dangerfield |99| Rory Laird |78| Rory Laird |152| Scott Thompson |85|
\3| Tom Lynch |86| Patrick Dangerfield |67| Scott Thompson |146| Rory Sloane |73|
\4| Brodie Smith |84| Rory Sloane |66| Matthew Jaensch |142| Cam Ellis-Yolmen |58|
\5| Taylor Walker |80| Sam Jacobs |54| Rory Sloane |137| Rory Laird |54|
\6| Ricky Henderson |79| David Mackay |51| Tom Lynch |130| Eddie Betts |51|
\7| Eddie Betts |78| Cam Ellis-Yolmen |48| Brodie Smith |122| Richard Douglas |45|
\8| Richard Douglas |75| Tom Lynch |44| David Mackay |121| Sam Jacobs |45|
\9| Rory Laird |74| Matthew Wright |42| Ricky Henderson |115| Brodie Smith |42|
\10| Rory Sloane |71| Daniel Talia |39| Richard Douglas |112| David Mackay |38

Rank| Uncont Poss |#| Disp eff % |#| Clangers |#| Marks |#
\1| Tom Lynch |98| Kyle Cheney |87.3| Taylor Walker |30| Matthew Jaensch |57|
\2| Rory Laird |98| Luke Brown |82| Patrick Dangerfield |25| Taylor Walker |55|
\3| Matthew Jaensch |97| Rory Laird |81.7| Matthew Wright |20| Tom Lynch |52|
\4| David Mackay |79| Jake Kelly |79.6| Brodie Smith |19| Rory Laird |41|
\5| Patrick Dangerfield |76| Matthew Jaensch |79.3| Richard Douglas |18| Sam Jacobs |36|
\6| Ricky Henderson |76| Matt Crouch |77.5| Rory Laird |18| Eddie Betts |33|
\7| Brodie Smith |73| Daniel Talia |76| Matthew Jaensch |17| Rory Sloane |31|
\8| Taylor Walker |71| Sam Jacobs |75.8| Rory Sloane |16| Kyle Cheney |31|
\9| Sam Jacobs |69| David Mackay |75.8| Charlie Cameron |16| Daniel Talia |30|
\10| Rory Sloane |68| Ricky Henderson |74.9| Tom Lynch |15| Jake Kelly |30

Rank| Cont marks |#| Marks50 |#| Hit-outs |#| Clearances |#
\1| Taylor Walker |8| Taylor Walker |29| Sam Jacobs |253| Scott Thompson |45|
\2| Eddie Betts |7| Eddie Betts |19| Josh Jenkins |26| Patrick Dangerfield |44|
\3| Patrick Dangerfield |5| Tom Lynch |13| Patrick Dangerfield |9| Cam Ellis-Yolmen |29|
\4| Sam Jacobs |5| Josh Jenkins |9| Cam Ellis-Yolmen |6| Rory Sloane |28|
\5| Tom Lynch |5| Patrick Dangerfield |7| Tom Lynch |2| Richard Douglas |25|
\6| Rory Laird |5| Charlie Cameron |7| Rory Sloane |1| Sam Jacobs |17|
\7| Kyle Cheney |5| Rory Sloane |3| Richard Douglas |1| Matthew Wright |14|
\8| Brodie Smith |4| Matthew Wright |3| Nathan Van Berlo |1| Brodie Smith |12|
\9| Matthew Jaensch |4| Mitch Grigg |2| || Nathan Van Berlo |11|
\10| Nathan Van Berlo |4| Brodie Smith |1| || Ricky Henderson |10

Rank| Centre clr |#| Stoppages |#| Rebound50 |#| Frees For |#
\1| Patrick Dangerfield |23| Scott Thompson |23| Matthew Jaensch |24| Scott Thompson |10|
\2| Scott Thompson |22| Rory Sloane |22| Ricky Henderson |19| Patrick Dangerfield |9|
\3| Cam Ellis-Yolmen |11| Patrick Dangerfield |21| Rory Laird |19| Rory Laird |9|
\4| Richard Douglas |9| Cam Ellis-Yolmen |18| David Mackay |19| Rory Sloane |8|
\5| Sam Jacobs |7| Richard Douglas |16| Brodie Smith |15| Sam Jacobs |7|
\6| Rory Sloane |6| Nathan Van Berlo |11| Kyle Cheney |15| Kyle Cheney |6|
\7| Eddie Betts |6| Matthew Wright |11| Nathan Van Berlo |13| Luke Brown |6|
\8| Jarryd Lyons |5| Brodie Smith |10| Daniel Talia |12| Daniel Talia |5|
\9| Matt Crouch |5| Ricky Henderson |10| Luke Brown |12| Cam Ellis-Yolmen |5|
\10| Matthew Wright |3| Sam Jacobs |10| Kyle Hartigan |9| Jake Kelly |5

Rank| Frees Agst |#| Tackles |#| One %s |#| Bounces |#
\1| Patrick Dangerfield |11| Patrick Dangerfield |45| Daniel Talia |39| Brodie Smith |9|
\2| Taylor Walker |10| Nathan Van Berlo |36| Sam Jacobs |23| Rory Sloane |8|
\3| Rory Laird |9| David Mackay |30| Ricky Henderson |16| Matthew Jaensch |7|
\4| Scott Thompson |9| Scott Thompson |29| Rory Laird |16| David Mackay |7|
\5| Rory Sloane |7| Richard Douglas |28| Kyle Cheney |16| Eddie Betts |6|
\6| Richard Douglas |7| Rory Sloane |27| Matthew Jaensch |15| Ricky Henderson |3|
\7| Matthew Wright |7| Cam Ellis-Yolmen |26| Kyle Hartigan |14| Tom Lynch |3|
\8| Brodie Smith |6| Eddie Betts |25| Jake Kelly |14| Patrick Dangerfield |2|
\9| Matthew Jaensch |5| Jake Kelly |21| Rory Sloane |13| Rory Laird |2|
\10| Jake Kelly |5| Matthew Wright |18| Luke Brown |13| Luke Brown |2

Rank| Inside50 |#| Goals |#| Behinds |#| Goal assists |#
\1| Patrick Dangerfield |34| Eddie Betts |26| Taylor Walker |12| Tom Lynch |9|
\2| Brodie Smith |33| Taylor Walker |21| Patrick Dangerfield |8| Eddie Betts |8|
\3| Tom Lynch |29| Tom Lynch |11| Eddie Betts |8| Taylor Walker |7|
\4| Ricky Henderson |24| Patrick Dangerfield |9| Charlie Cameron |8| Brodie Smith |5|
\5| Taylor Walker |24| Josh Jenkins |8| Tom Lynch |7| Richard Douglas |5|
\6| Eddie Betts |24| Charlie Cameron |7| Brodie Smith |5| Nathan Van Berlo |5|
\7| Cam Ellis-Yolmen |22| Scott Thompson |4| Josh Jenkins |4| Matthew Wright |5|
\8| Matthew Wright |22| Rory Sloane |3| Nathan Van Berlo |3| Rory Sloane |4|
\9| Richard Douglas |21| Brodie Smith |3| Rory Sloane |2| Patrick Dangerfield |4|
\10| Rory Sloane |19| Mitch Grigg |3| Matthew Jaensch |2| Cam Ellis-Yolmen |4

Rank| Goal acc % |#| Time On Ground % |#| AFL Fantasy |#| Exie |#
\1| Richard Douglas |100| Kyle Hartigan |99.5| Patrick Dangerfield |718| Patrick Dangerfield |841|
\2| Ricky Henderson |100| Daniel Talia |97.1| Sam Jacobs |695| Eddie Betts |806|
\3| Sam Jacobs |100| Jake Lever |96| Eddie Betts |658| Sam Jacobs |791|
\4| Scott Thompson |100| Kyle Cheney |95.4| Tom Lynch |631| Tom Lynch |779|
\5| Luke Brown |100| Taylor Walker |94.6| Matthew Jaensch |624| Taylor Walker |779|
\6| Eddie Betts |76.5| Eddie Betts |92.1| Taylor Walker |604| Matthew Jaensch |764|
\7| Mitch Grigg |75| Sam Jacobs |88.1| Rory Sloane |554| Rory Laird |672|
\8| Cam Ellis-Yolmen |66.7| Tom Lynch |87.4| Rory Laird |554| Rory Sloane |664|
\9| Josh Jenkins |66.7| Jake Kelly |86.8| Scott Thompson |524| Scott Thompson |610|
\10| Taylor Walker |63.6| Patrick Dangerfield |84.1| David Mackay |511| David Mackay |601

UPDATED POST RD 7
Quoted for truth.
 
Updated for round 8

Player|Metric|Season Amount|This Week|Average Per Game|Games Played
\Josh "Goose" Jenkins| Contested Marks|3|1|0.5|6
\David "$400,000" Mackay| Below Average Disposal Games|4|0|18.1|8
\Matthew "Small Forward" Wright| Goals|0|0|0.0|8
\Kyle "Clanger" Hartigan | Clangers|7|0 (Omitted)|1.75|4
\Nathan "Cooler" Van Berlo| Possessions|117|19|14.6|8
\Ricky "Footsteps" Henderson| Tackles|8|0 (Injured)|1.3|6

Mackay doing well. Jenkins took a contested mark but was average. VB shithouse. Wright invisible.

Lyons-Grigg Trophy

Player|Games as Sub|Games on Field
\Jarryd Lyons|4|1
\Matthew Wright|2|6
\Mitch Grigg|1|3
\Matt Crouch|1|2
 
The great support for Wrighty from Phil and the coaches reminds me of the criticism of Kenny "the Gun" McGregor in his later years. A Crow's spokesman (possible Harper) said that Kenny was playing a valuable role for the team and the general fan did not appreciate what he was doing. When asked "Well, what is Ken's role?" his answer was " It's Ken's role to be where the ball isn't".

I thought at the time how close I came to being an AFL footballer since I was usually where the ball wasn't :D.

Jack, its just all about the tense. :D
 
Updated for round 8

Player|Metric|Season Amount|This Week|Average Per Game|Games Played
\Josh "Goose" Jenkins| Contested Marks|3|1|0.5|6
\David "$400,000" Mackay| Below Average Disposal Games|4|0|18.1|8
\Matthew "Small Forward" Wright| Goals|0|0|0.0|8 \Kyle "Clanger" Hartigan | Clangers|7|0 (Omitted)|1.75|4
\Nathan "Cooler" Van Berlo| Possessions|117|19|14.6|8
\Ricky "Footsteps" Henderson| Tackles|8|0 (Injured)|1.3|6

Mackay doing well. Jenkins took a contested mark but was average. VB shithouse. Wright invisible.

Lyons-Grigg Trophy

Player|Games as Sub|Games on Field
\Jarryd Lyons|4|1
\Matthew Wright|2|6
\Mitch Grigg|1|3
\Matt Crouch|1|2
Dat point though!
 
I muck around with some stats regarding who played who so far this year - using the current ladder as the guide.

Here are the ratings up until Round 7, from easiest to toughest:

Richmond 1
Collingwood 2
West Coast 3
Adelaide 4
Brisbane 5
GWS Giants 6
Essendon 7
Gold Coast 8
Hawthorn 9
St Kilda 10
Carlton 11
Geelong 12
North Melbourne 13
Fremantle 14
Sydney 15
Melbourne 16
Western Bulldogs 17
Port Adelaide 18

And here are the ratings for the remainder of the year, again from easiest to toughest:

Western Bulldogs 1
GWS Giants 2
Sydney 3
Brisbane 4
Melbourne 5
Hawthorn 6
Fremantle 7
North Melbourne 8
Port Adelaide 9
Carlton 10
Essendon 11
St Kilda 12
Adelaide 13
Geelong 14
Collingwood 15
Gold Coast 16
West Coast 17
Richmond 18

It's all based on the current ladder and doesn't usually start making sense till after the mid-way point when ladder positions are less volatile.

It is a very raw stat, but always throws up some interesting questions ...

For instance:
  • expect the Bulldogs to rally
  • expect Richmond / West Coast / Collingwood to drop
  • GWS should be able to hold it's spot in the 8
  • AFC have had an easy run so far
  • Port have started with a tough draw
It also picks up "upset" wins and losses - again based on the ladder:

upsets.png
 
http://afltables.com/afl/stats/games/2015/012120150523.html

GWS
Average Age 23y 180d total games 1656
Number of players under 20 games: 2
Number of players under 50 games: 7

Adelaide
Average age 24y 96d
total games 1674
Number of players under 20 games: 5
Number of players under 50 games: 11

Our average age was about 9 months older. Average experience comprable. We played a greater number of emerging players.


Round|Crows ave age|Crows career games|avg|Opposition|Opp ave age|opp career games|avg
\1 | 24y 321d | 1715 | 77.95 | Kangaroos | 26y 337d | 2982 | 135.55
\2 | 24y 320d | 1728 | 78.55 | Magpies | 24y 98d | 1723 | 78.32
\3 | 25y 35d | 1956 | 88.91 | Demons | 24y 247d | 1835 | 83.41
\4 | 25y 75d | 1991 | 90.50 | Bulldogs | 23y 320d | 1360 | 61.82
\5 | 25y 86d | 2028 | 92.18 | Power | 25y 353d | 2500 | 113.64
\6 | 24y 141d | 1809 | 82.23 | Suns | 23y 20d | 1100 | 50.00
\7 | 24y 173d | 1794 | 81.55 | Saints | 24y 81d | 1630 | 74.09
\8 | 24y 96d | 1674 | 76.09 | Giants | 23y 180d | 1656 | 75.27
\9 | 24y 177d | 1704 | 77.45 | Dockers | 26y 346d | 2877 | 130.77
 

Remove this Banner Ad

Back
Top