
Round 10, 2014
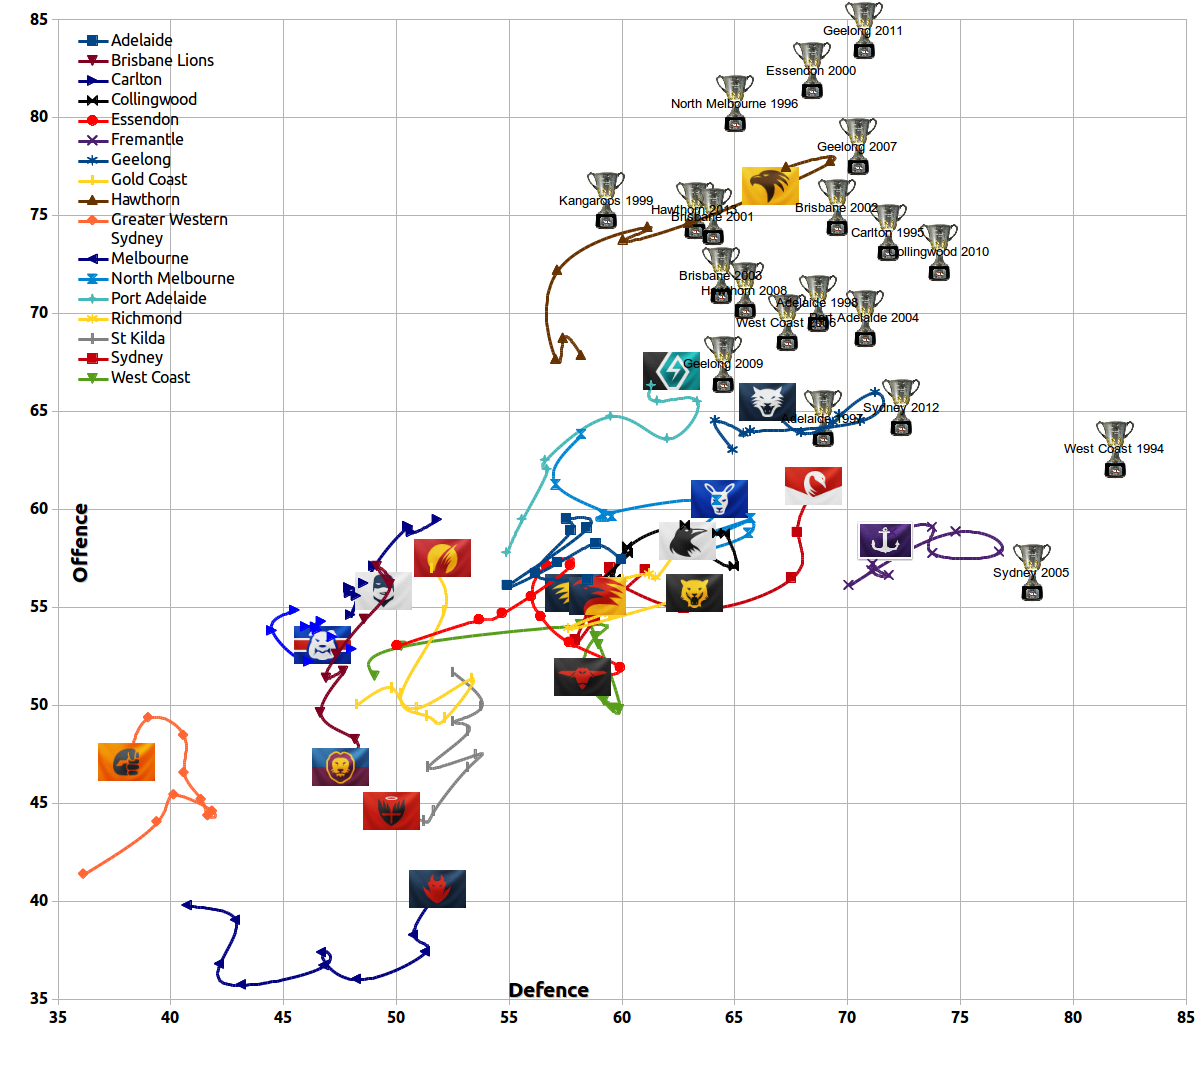
Pretty happy with our position (which has only fallen away slightly) despite losing games away to Sydney and Port Adelaide.
Should move shapely back to the top right with a game against GWS this week
Follow along with the video below to see how to install our site as a web app on your home screen.
Note: This feature may not be available in some browsers.

 BigFooty AFLW Notice Img
AFLW 2025 - AFLW Trade and Draft - All the player moves
Due to a number of factors, support for the current BigFooty mobile app has been discontinued. Your BigFooty login will no longer work on the Tapatalk or the BigFooty App - which is based on Tapatalk.
Apologies for any inconvenience. We will try to find a replacement.
Round 10, 2014
Since 1980...Final Siren, at the end of which home and away season was the gap between the best and worst teams (on your chart) the smallest?
 ). Squiggle must really think absolutely nothing of GWS since we slid about ten times the (combined offense/defense) for the win, then we did for the loss against North! Melbourne is much improved so I doubt we'll flog them away this round, but hopefully it's a nice sunny day in two weeks against the Saints to shift up and right.
Log in to remove this Banner Ad
What a great idea! It looks like this:Is there a squiggle for only 2014 games? So you can see how teams are going this year, based on how good / bad their opposition is this year only (E.g. games against Brisbane would rate lower than taking 2013 into account, where as against GC would rate higher). So basically every team would start at 50/50 offense / defense and go from there on 2014 results.

Would I be correct in saying that better early season performances against the better teams wouldn't carry as much weighting as opposed to the regular model you post here? ie. Essendon getting within 4 points of Hawthorn earlier this season wouldn't be worth as much as in the regular model as Hawthorn still hadn't moved out to their "true" position yet (something their 2013 data helped offset).What a great idea! It looks like this:
2014 Squiggle Where Every Team Starts at 50/50
ROUND 10 TIPS
Geelong 89 - 68 North Melbourne

Greater Western Sydney 79 - 112 Richmond

Collingwood 88 - 64 West Coast

Port Adelaide 90 - 102 Hawthorn

Gold Coast 109 - 82 Western Bulldogs

Carlton 88 - 93 Adelaide

Do you think the Hawks will still win this one? Port are very short priced favourites to win this one, $1.42 on sportsbet.
They're up now.What are the chances of getting a set of squiggle predictions for round 11?


All true. West Coast are probably in the weirdest position on that chart, largely thanks to thrashing Melbourne in Round 2.Would I be correct in saying that better early season performances against the better teams wouldn't carry as much weighting as opposed to the regular model you post here? ie. Essendon getting within 4 points of Hawthorn earlier this season wouldn't be worth as much as in the regular model as Hawthorn still hadn't moved out to their "true" position yet (something their 2013 data helped offset).
Similarly poor performances against bad teams also wouldn't hurt as much early on in the season as opposed to the regular model.
That said, this still looks pretty much what you'd expect it to based on the season so far so if what I've said is accurate there's obviously a lot to be said about this systems way of self correcting.
The sguiggle does not lie!!! It speaks the truth...All true. West Coast are probably in the weirdest position on that chart, largely thanks to thrashing Melbourne in Round 2.
Although the Eagles are hard to depict accurately at all this year, because they've been a bit of a flat-track bully, beating up on weak teams and crashing to good ones.
Steady on, I'm not made of squiggles.Are you able to update this each round as well? Thanks again
Gee, I though you were made of squiggles and spice and all things nice.Steady on, I'm not made of squiggles.
Welllll is there a way we can edit the interactive squiggle to make it do it for us?Steady on, I'm not made of squiggles.
The sguiggle does not lie!!! It speaks the truth...
Shouldn't matter too much yet, as long as we get wins. We made the GF last year around the same position on the squiggle chart.True. Fremantle don't have the scoring power to challenge.
Steady on, I'm not made of squiggles.

Actually the Hawks will probably retreat.Depressing weekend of squiggles, hawthorn will destroy gws and be so far ahead of everyone else when they really aren't
You dare question the squiggles?!Depressing weekend of squiggles, hawthorn will destroy gws and be so far ahead of everyone else when they really aren't