Remove this Banner Ad

Draft Review 2023 - Re-do the draft

  • Thread starter Thread starter danster168
  • Start date Start date
  • Tagged users Tagged users None

🥰 Love BigFooty? Join now for free.

I read what you were basing it off.
Would still argue strongly COS is on that list ahead of Curtin, Wilson and Sanders.
look to be fair, I didnt bother looking to far down the list mate. I value your input on BigFooty, wasn't looking too far down the rankings. Could well make a case as you say for some interchanging to those at the bottom of the 10
 
I'd still take Harley 1st.
First 3 years I'd still be going something like 80% on potential, 20% on performance. So yeah Harley and even guys like Walter would still be considered high.
 
my rankings was based on the careers so far, lets all cool our jets a bit here.
You are significantly overrating Robert’s here, probably the easiest position in football to play. Good stats and decent player but impact far below what the numbers say.

No where near guys like Reid, Morris, Watson on current output or potential
 

Log in to remove this Banner Ad

You are significantly overrating Robert’s here, probably the easiest position in football to play. Good stats and decent player but impact far below what the numbers say.

No where near guys like Reid, Morris, Watson on current output or potential
im just going with actual output and influence on games
 
im just going with actual output and influence on games
I know but I think you are vastly overrating Robert’s impact or underrating the others
 
Roberts should now be considered along side someone like Curtin who had a period of footy last year that was class. I originally had him Tier 4 that's too low, tier 3 boarding tier 2 is his go, for now let's see how he goes on with it.

Revised after 5 weeks this year.

Tier 1
Ried, Watson, Morris
Tier 2
Mannagh, Freijah, Mckercher, Caddy
Tier 3
Curtin, Roberts, Sanders, O'Sullivan, Read
Tier 4
Humphries, Walter, Duursma, Wilson, Windsor, Garcia, Fonti, Thomas, Graham, Dear

I'll revisit it again end of season but as of right now this is where I see it.
 
are posters under rating Roberts' game having gone to another level ?
Don’t think so, he’s a good player. He is however playing the easiest position on the ground, and his raw numbers are elite but I don’t think he’s a highly damaging player.

Benefited greatly especially these past 2 weeks from the game plan
 
I'd still take Harley 1st.
For the remainder of this season I'd take Nick Watson.

Beyond that, probably Reid but only if he cleans up his game, and he needs to improve his fitness.
 
Hard to argue against Watson being Tier 1 any longer.

Along with Harley will be out ahead but from them onwards though it's really close with a number of players stepping up this year.

Yr 3 not surprising but it's good to see.
 

Remove this Banner Ad

I have been working on a player ratings projects which I outlined in the statistics forum. Here is the list of players from 2023 ranked by my player rating based on the four models for 2026. Lawson Humphries has been a huge improver.

2023 National Draft — AFLIA Top 20 in 2026
Players filtered by draft_year = 2023 and draft_type = nationalDraft.
Table uses 2026 AFLIA average to Round 11.

If you want details how the player ratings work, go to the statistics forum and read my thread.


Stay at home forwards generally have high forward totals but not elsewhere but CAN and DO still achieve very high scores but are never consistent enough.


2023 National Draft — Top 20 by 2026 AFLIA Average
RankPlayerTeamPositionDraft PickGamesAFLIA AvgGain AvgTerritory AvgForward AvgDefence Avg
1archie robertsEssendonMEDIUM_DEFENDER54114.241.291.830.111.01
2harley reidWest CoastMIDFIELDER1112.911.580.950.82-0.43
3lawson humphriesGeelongMEDIUM_DEFENDER63112.460.091.260.170.94
4kane mcauliffeRichmondMIDFIELDER4061.780.100.940.090.65
5ryley sandersWestern BulldogsMIDFIELDER6101.501.54-0.250.26-0.06
6hugo garciaSt KildaMIDFIELDER50111.411.190.130.52-0.43
7darcy wilsonSt KildaMIDFIELDER_FORWARD18101.130.010.450.640.03
8koltyn tholstrupMelbourneMEDIUM_DEFENDER13111.040.030.65-0.280.65
9harvey thomasGWSMIDFIELDER59110.970.500.100.230.13
10joel freijahWestern BulldogsMIDFIELDER_FORWARD45110.960.49-0.030.51-0.01
11connor osullivanGeelongKEY_DEFENDER11100.90-0.030.17-0.691.45
12joseph fontiGWSMEDIUM_DEFENDER44100.80-0.020.29-0.651.17
13shaun mannaghGeelongMEDIUM_FORWARD36110.57-0.350.651.01-0.74
14colby mckercherNorth MelbourneMEDIUM_DEFENDER2110.460.010.660.19-0.41
15nick watsonHawthornMEDIUM_FORWARD5110.43-0.04-0.081.02-0.47
16caleb windsorMelbourneMIDFIELDER7100.12-0.150.370.10-0.20
17logan morrisBrisbaneKEY_FORWARD3110-0.32-0.62-0.401.65-0.96
18nate caddyEssendonKEY_FORWARD1010-0.67-1.05-0.011.10-0.70
19phoenix gothardGWSMEDIUM_FORWARD1211-0.75-0.28-0.410.59-0.66
20charlie edwardsAdelaideMEDIUM_DEFENDER212-0.81-0.570.44-0.37-0.30
 
I have been working on a player ratings projects which I outlined in the statistics forum. Here is the list of players from 2023 ranked by my player rating based on the four models for 2026. Lawson Humphries has been a huge improver.

2023 National Draft — AFLIA Top 20 in 2026
Players filtered by draft_year = 2023 and draft_type = nationalDraft.
Table uses 2026 AFLIA average to Round 11.

If you want details how the player ratings work, go to the statistics forum and read my thread.


2023 National Draft — Top 20 by 2026 AFLIA Average
RankPlayerTeamPositionDraft PickGamesAFLIA AvgGain AvgTerritory AvgForward AvgDefence Avg
1archie robertsEssendonMEDIUM_DEFENDER54114.241.291.830.111.01
2harley reidWest CoastMIDFIELDER1112.911.580.950.82-0.43
3lawson humphriesGeelongMEDIUM_DEFENDER63112.460.091.260.170.94
4kane mcauliffeRichmondMIDFIELDER4061.780.100.940.090.65
5ryley sandersWestern BulldogsMIDFIELDER6101.501.54-0.250.26-0.06
6hugo garciaSt KildaMIDFIELDER50111.411.190.130.52-0.43
7darcy wilsonSt KildaMIDFIELDER_FORWARD18101.130.010.450.640.03
8koltyn tholstrupMelbourneMEDIUM_DEFENDER13111.040.030.65-0.280.65
9harvey thomasGWSMIDFIELDER59110.970.500.100.230.13
10joel freijahWestern BulldogsMIDFIELDER_FORWARD45110.960.49-0.030.51-0.01
11connor osullivanGeelongKEY_DEFENDER11100.90-0.030.17-0.691.45
12joseph fontiGWSMEDIUM_DEFENDER44100.80-0.020.29-0.651.17
13shaun mannaghGeelongMEDIUM_FORWARD36110.57-0.350.651.01-0.74
14colby mckercherNorth MelbourneMEDIUM_DEFENDER2110.460.010.660.19-0.41
15nick watsonHawthornMEDIUM_FORWARD5110.43-0.04-0.081.02-0.47
16caleb windsorMelbourneMIDFIELDER7100.12-0.150.370.10-0.20
17logan morrisBrisbaneKEY_FORWARD3110-0.32-0.62-0.401.65-0.96
18nate caddyEssendonKEY_FORWARD1010-0.67-1.05-0.011.10-0.70
19phoenix gothardGWSMEDIUM_FORWARD1211-0.75-0.28-0.410.59-0.66
20charlie edwardsAdelaideMEDIUM_DEFENDER212-0.81-0.570.44-0.37-0.30
Do you intend to refine the model given how much it deviates from the consensus? I love stats, but a model that has Roberts at the top, Watson at 15, Tholt at 8 etc., seems like it has flaws?
 

🥰 Love BigFooty? Join now for free.

Do you intend to refine the model given how much it deviates from the consensus? I love stats, but a model that has Roberts at the top, Watson at 15, Tholt at 8 etc., seems like it has flaws?
Read my thread:

0 = the average from 2024, and 2025. 1 is 1 standard deviation above that average. It is purely data driven from that data by the models built by regression weights. Meaning Archie Roberts territory work is 1.83 standard deviations above the average. It gives a good indication of WHERE a player lies compared to every other player. For a player who scores over 2.5, they are elite.

And why, Archie Roberts has been outstanding this season and there is very high level of consensus over that. Reid has NOT been consistent.

It's also based on 2026 only.

I'm likely to make refinements to my model as I go, but not because people disagree with it.
 
Read my thread:

0 = the average from 2024, and 2025. 1 is 1 standard deviation above that average. It is purely data driven from that data by the models built by regression weights. Meaning Archie Roberts territory work is 1.83 standard deviations above the average. It gives a good indication of WHERE a player lies compared to every other player. For a player who scores over 2.5, they are elite.

And why, Archie Roberts has been outstanding this season and there is very high level of consensus over that. Reid has NOT been consistent.

It's also based on 2026 only.

I'm likely to make refinements to my model as I go, but not because people disagree with it.
I am sorry if you felt like I was shitting on you, I was actually curious.

I don't really agree with Roberts being outstanding though, he is a great fantasy player and a great stat sheet player, but doesn't especially do a lot in my opinion.

How does the model / does the model value possession location, metres gained per disposal/kick/hb, threat, retention, kick ins, hb receives etc.? He's a guy that racks up almost all of his touches in the back half of the ground, doesn't especially contribute to scoring, doesn't contribute much defensively, etc. which can all be found in the stats.
 
Read my thread:

0 = the average from 2024, and 2025. 1 is 1 standard deviation above that average. It is purely data driven from that data by the models built by regression weights. Meaning Archie Roberts territory work is 1.83 standard deviations above the average. It gives a good indication of WHERE a player lies compared to every other player. For a player who scores over 2.5, they are elite.

And why, Archie Roberts has been outstanding this season and there is very high level of consensus over that. Reid has NOT been consistent.

It's also based on 2026 only.

I'm likely to make refinements to my model as I go, but not because people disagree with it.
Is it just one set of averages for everyone player or is there different sets of averages for different positions, example so key forwards are only compared against each other.
 
I am sorry if you felt like I was shitting on you, I was actually curious.

I don't really agree with Roberts being outstanding though, he is a great fantasy player and a great stat sheet player, but doesn't especially do a lot in my opinion.

How does the model / does the model value possession location, metres gained per disposal/kick/hb, threat, retention, kick ins, hb receives etc.? He's a guy that racks up almost all of his touches in the back half of the ground, doesn't especially contribute to scoring, doesn't contribute much defensively, etc. which can all be found in the stats.
Sorry, It's hard to tell sometimes so thanks for letting me know.

I've avoided sharing my content on other threads because I've seen how people behave. The model basically gives a good understanding of how people are playing in 2026 relative to the data in 2024 and 2025. It's definitely not perfect and no model is. I chose 2 years of data because of the constant evolving game which I've noticed clear trends already particularly with Clayton Oliver being an outlier, and MG increased across the board.

Even if my model had some weaknesses, players in 2026 are being ranked the same as in 2024, and 2025. I concede forwards are going to struggle but I have seen super huge scores from forwards just not enough of them.

I'll concede that the scores seem to work better for the best players and definitely pass the eye test. I'm very satisfied personally with the top 10. Down lower it tends to get a little noisier but it is what it is. What it does do, is give a good indication how a player tracks over time.

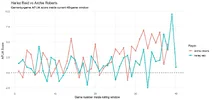
In terms of Archie Roberts, he's getting most of his scores from territory, mostly defensive to forward transition, and a little more than Reid.

Here's the chart of each players rolling 46 games. Reid has the higher peak. I have no doubt Reid will overtake Roberts at some point in the future.


ReidRoberts.webp
 
Is it just one set of averages for everyone player or is there different sets of averages for different positions, example so key forwards are only compared against each other.
They're all the same and weighted equally. Generally someone like Nick Blakey will score all round but his scores are lower in each model, Forwards and defenders are capable of getting big scores but not consistently enough. Treacey generally does more contested work than Gunston, but Jack has a bigger forward score.

I'd certainly be comparing apples with apples and with respect to forwards I am exploring a finishing model to compare forwards separately.
 
I can definitely see Harley Reid being clear #1 at this trajectory and by next season could be top 10 all round
 

Remove this Banner Ad

Remove this Banner Ad

🥰 Love BigFooty? Join now for free.

Back
Top Bottom