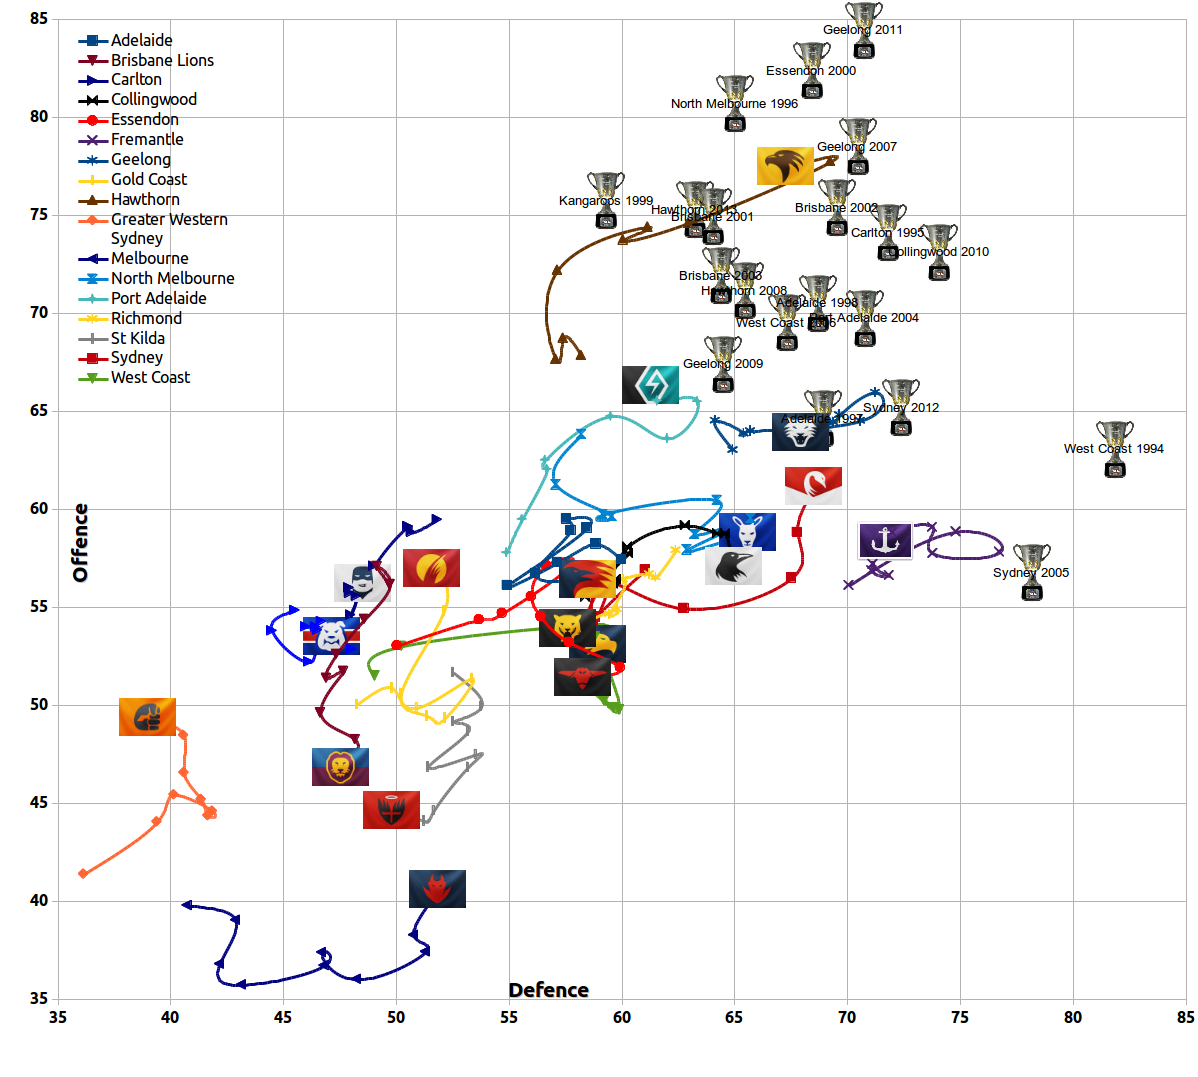
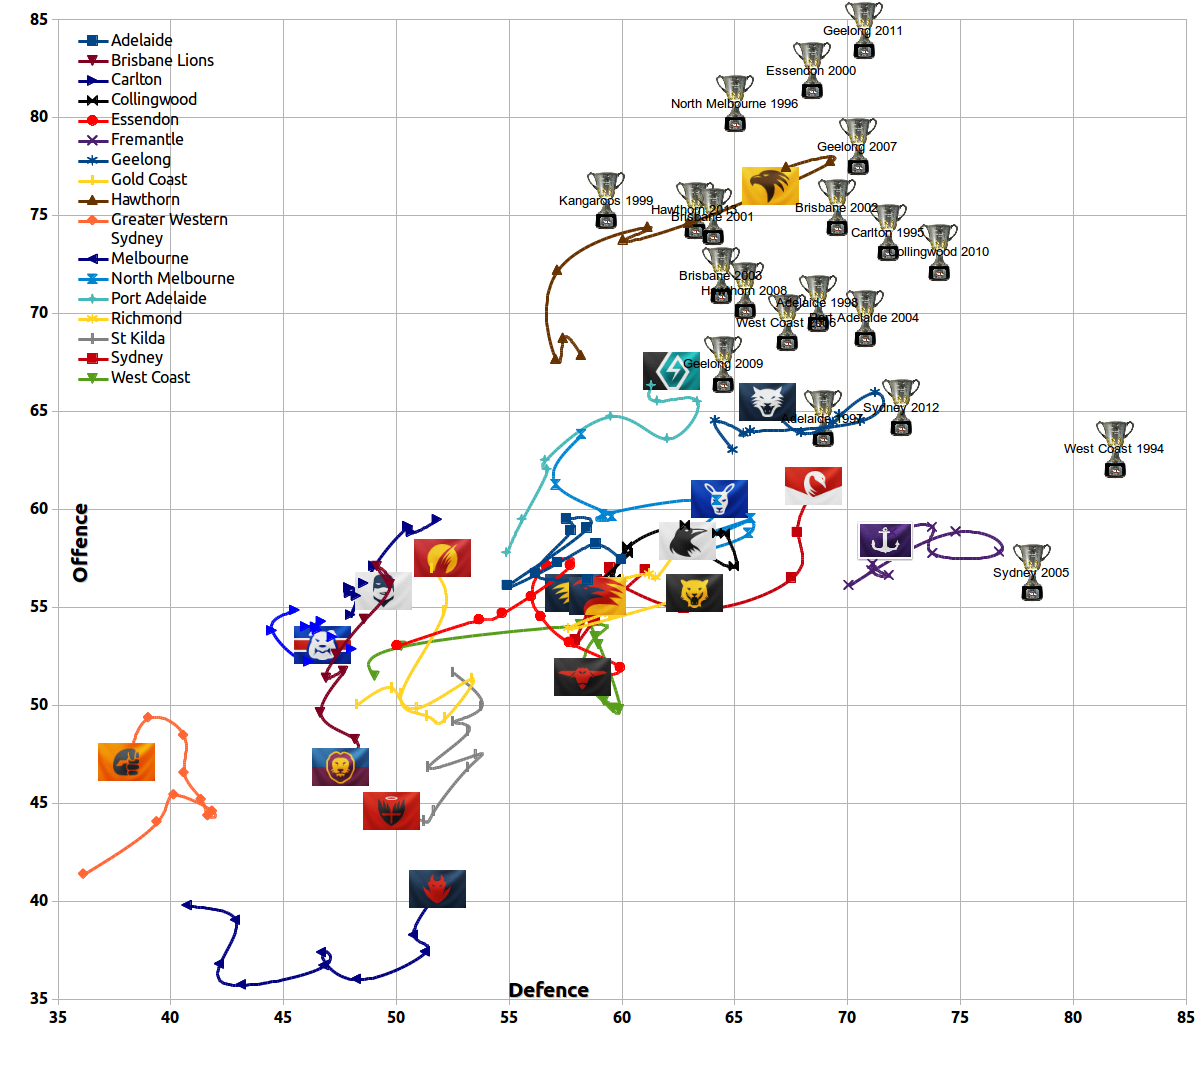
Certified Legendary Thread Race for the flag, in squiggly lines

Remove this Banner Ad

That's always been the case when Franklin has played. I can't really see Collingwood beating the Hawks. I see them providing a good contest but that's about it really. Unless the Hawks have more injuries in their midfield, I'd expect them to beat Collingwood in both games.

Agreed. That said probably our best performance amongst the five games mentioned was when Buddy wasn't playing, in round 17 2012. Aside from the Sydney and Fremantle matches in 2013 and 2014 that was probably the most complete performance I've seen us play in years
 
Tell me where I said any of this.
I just dont think Hawthorn losing a couple of players here and there will weaken them. They have a good system and role players who come in and perform.
Its why they are number 1. A Hawthorn at 80% would still beat most of the competition.
 

Log in to remove this ad.

Final Siren How did you arrive at ±6 for home advantage, and is it possible to include more parameters (e.g., away in SA vs. away in WA or home vs. away intrastate)? Do you think it would be possible to determine them by some best fit of postdictions to historical results?
That's exactly what I did: test all possible values and see which numbers worked best. Interstate advantage seems to be worth 12 points on a pretty reliable basis, good enough for a rule of thumb.

I have been looking at refining it, though. An algorithm I have that's tipping at 73.3% this year (55/75) is VENUE-90:80:OFFDEF, which goes back an extra two years to generate a home ground advantage score for every team at every ground.

On average, this comes out at around a 12-point differential for interstate teams, just like it should. But it is a lot more specific:

hAvhZQX.png


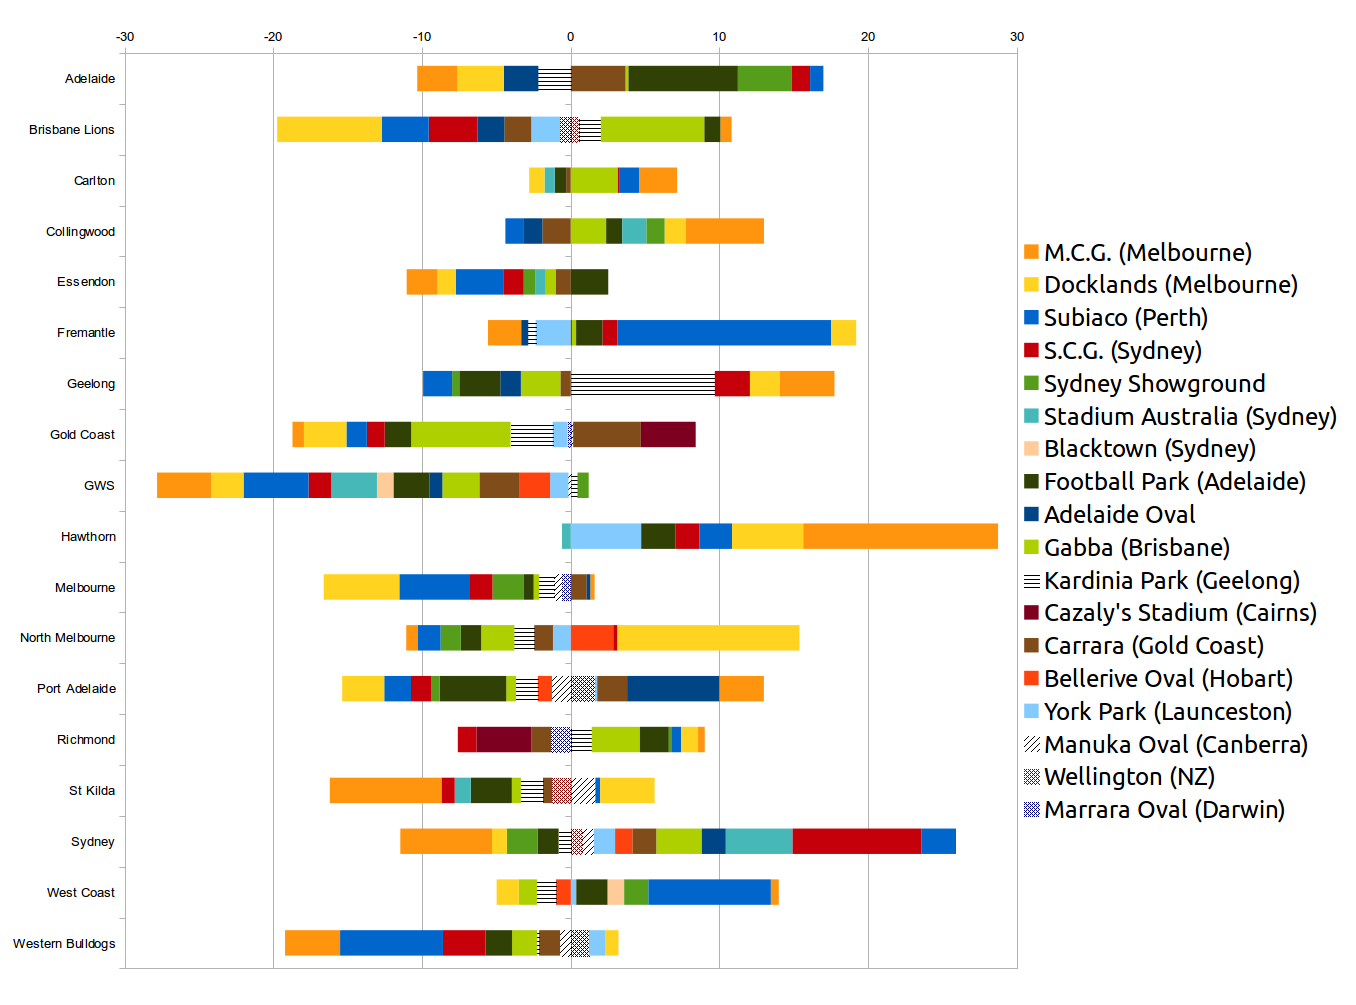
To explain that: blocks of colour to the right of 0 means the team performed better at that venue than the squiggle expected, and blocks of colour to the left of 0 mean they did worse. If it's a big block, it's a big difference; if it's small, it's only a little difference.

So you can see plenty of results that make intuitive sense, like Fremantle and West Coast doing a lot better at Subiaco; Sydney does better at the SCG than the MCG; Brisbane likes the Gabba, and Richmond hates Cairns.

Hawthorn likes everywhere.

When tipping a match, this algorithm uses the advantage of both teams at that venue. Sometimes this means one team's advantage will largely cancel out another's, like Fremantle vs West Coast. Other times they will work in the same direction to create a large advantage, like Subiaco hosting West Coast (+8.24) vs Western Bulldogs (-6.92).

So far this seems mostly helpful in letting the algorithm resolve close tips the right way. And it's doing that well, so far, but it's new and I haven't had much time to play with it yet.

Anyway, according to this algorithm, the biggest home ground advantages are:
  1. Fremantle at Subiaco
  2. Hawthorn at the MCG (... although there's not really anywhere good to play them)
  3. North Melbourne at Docklands
  4. Geelong at Kardinia Park
  5. Sydney at the SCG
  6. West Coast at Subiaco
 
Last edited:
ROUND 10 TIPS

Geelong.png
Geelong 89 - 68 North Melbourne
North%20Melbourne.png


Greater%20Western%20Sydney.png
Greater Western Sydney 79 - 112 Richmond
Richmond.png


Collingwood.png
Collingwood 88 - 64 West Coast
West%20Coast.png


Port%20Adelaide.png
Port Adelaide 90 - 102 Hawthorn
Hawthorn.png


Gold%20Coast.png
Gold Coast 109 - 82 Western Bulldogs
Western%20Bulldogs.png


Carlton.png
Carlton 88 - 93 Adelaide
Adelaide.png


Do you think the Hawks will still win this one? Port are very short priced favourites to win this one, $1.42 on sportsbet.
 
FinalSiren Wow, that home ground advantage chart is insane. I didn't realise that Hawks were so strong literally everywhere and the Swans aren't far behind. Except the losses @ the MCG, the Swans are almost as strong as Hawks playing anywhere.

What are the tips for Swans vs Cats in 2 rounds time? :p
Notice how Swans usually play well at ANZ :p
 
ROUND 10 TIPS

Geelong.png
Geelong 89 - 68 North Melbourne
North%20Melbourne.png


Greater%20Western%20Sydney.png
Greater Western Sydney 79 - 112 Richmond
Richmond.png


Collingwood.png
Collingwood 88 - 64 West Coast
West%20Coast.png


Port%20Adelaide.png
Port Adelaide 90 - 102 Hawthorn
Hawthorn.png


Gold%20Coast.png
Gold Coast 109 - 82 Western Bulldogs
Western%20Bulldogs.png


Carlton.png
Carlton 88 - 93 Adelaide
Adelaide.png


Do you think the Hawks will still win this one? Port are very short priced favourites to win this one, $1.42 on sportsbet.
He has said the squiggle is blind to things like missing personnel. You have to take the things it doesn't take into account into consideration for yourself using this as a guide. So I imagine he might be leaning towards Port.
 
Essendons run only lasted 4 weeks this year. They really are lacking quality forward talls.
Geelong in a form slump. The Easter Monday hangover has last several weeks.
Sydneys power forward line starting to take effect.
North became a defensive team in the space of a month with the acquisition of Tudor and Dal Santo.
Gold Coast the big improve this far and will continue again this week.
Brisbane struggling and West Coast coming back with a thud.
 
Okay, most of the home ground advantage chart makes sense until I get to the Swans at Subiaco. Am I reading that wrong or should Sydney get the HGA adjustment when they head over to play WC in round 16?
 

(Log in to remove this ad.)

Okay, most of the home ground advantage chart makes sense until I get to the Swans at Subiaco. Am I reading that wrong or should Sydney get the HGA adjustment when they head over to play WC in round 16?
I think you're reading it wrong. The way I read it, it's saying that Sydney is about a 3 point better side at Subiaco than their base line score, but West Coast is about a 9 point better side than their base line score there. Hence West Coast will have about a 1 goal advantage.
 
I think you're reading it wrong. The way I read it, it's saying that Sydney is about a 3 point better side at Subiaco than their base line score, but West Coast is about a 9 point better side than their base line score there. Hence West Coast will have about a 1 goal advantage.
Yep, that's it. The stacked bar chart can be a little misleading. When you're looking at a particular venue for a particular team, what matters is how long the coloured block is and whether it's positive or negative. But exactly where it sits (either close to 0 or farther away) is irrelevant, because they are in random order.
 
About 140 points will do it.

#squiggleanticipation

(Edit: Oh sorry, that is to overtake Hawthorn. Not sure what you would consider significant movement.)

Thanks mate, that pretty much answers my question anyway.

I wasn't sure how it all works so didn't even know if it was possible to 'bridge the gap' to a large degree in just one game.

Sounds like about a ten goal win would probably achieve the kind of movement I'm thinking of.
 
FinalSiren Wow, that home ground advantage chart is insane. I didn't realise that Hawks were so strong literally everywhere and the Swans aren't far behind. Except the losses @ the MCG, the Swans are almost as strong as Hawks playing anywhere.

What are the tips for Swans vs Cats in 2 rounds time? :p

Similar.

That said, Hawthorn's record at Ethiad is superior to its record at the MCG. It hasn't lost a game at the venue since round 3, 2010 and have won every game at the stadium since 2010 draw against St Kilda (who were significantly better than Hawthorn that season). That's 10 games on the trot and 11-1-1 since the start of 2010

During that same time, the Hawks have played 57 games at the MCG (48 home + away and 9 finals), won 40 games and lost 17.

Like for like, Ethiad Stadium complements Hawthorn's precise kicking game plan more than any other stadium...
 
Love this thread guys.

Just as we can calculate a team specific modifier for individual grounds, have we tried team specific modifiers vs other teams? Eg Cats better and Hawks worse head to head? Does this help the model at all, especially when combined with team specific ground modifiers?
 
Round 10, 2014

edRtaMa.png

WTF: Gold Coast edition

Gold Coast sit 3rd on the ladder with 7 wins and 2 losses, and are widely considered a lock for finals. But the squiggle doesn't rate them. Why not?

Essentially it's because most of the Suns' results were about what the squiggle expected for a team in that position. They've done a little better, but not that much.

Four of the Suns' wins have come against weak teams (GWS, Melbourne, Brisbane, St Kilda), and two were over mediocre opposition aided by home-state advantage (Richmond, Western Bulldogs).

Of these, only the Brisbane win (114-61) and the St Kilda win (87-125) were significantly better than the squiggle expected. When a team is expected to narrowly lose and instead they narrowly win, the squiggle doesn't adjust its expectations much. It thinks it has that team mostly right, and they stay where they are.

The only time the Suns have really surprised this year was in beating North Melbourne 77-120. That definitely shifted them. But that movement is counteracted by terrible losses to Fremantle (87-39) and Hawthorn (49-148).

What the squiggle really likes to see are honourable losses against top teams, triple-digit thrashings of bad teams, and holding an opposition to a low score. Those things create a lot of squiggle movement. The Suns haven't done any of them.

So the squiggle is yet to be impressed.
 

Remove this Banner Ad

Back
Top