Mega Thread The Stats Thread

Remove this Banner Ad

From Round 7 inclusive onwards, Champion Data ranking points have placed Melbourne #1 and Sydney #2 during their period.

Despite missing the services of top forward Jesse Hogan and top ruckman Max Gawn for all but 1 of those games, the Demons are clearly the number 1 ranked attack in the AFL, ranking 1st in goals (15.6 per game), 1st in goalkicking accuracy (65.3%) and 2nd in goals per inside 50 (27.95%). They have achieved a greater spread of goalkickers led by small forwards Jeff Garlett (14 goals), Mitch Hannan (11) and makeshift forward/ruck Tom McDonald (10).

Led by the high ranking in tackles inside 50 (14.6 per game ranked 4th), the Demons are ranked second in scoring goals from turnovers (9.3 goals per game)

The Swans are also highly ranked in the attacking categories 3rd in goals (14.6 per game) and 6th in goals per inside 50 (26.09%) but undoubtedly their good form is based on their increased defensive efforts. The Swans are ranked 2nd in goals conceded (10.4 per game), 2nd in opposition goals per inside 50 conceded (21.66%) and have the 2nd most intercept marks during this period (16.9 per game)

In the midfield, Melbourne has averaged the most disposals since Round 7, and are also ranked 1st in contested possessions. Both midfields have dominated in the past 7 rounds, with the Demons and the Swans both having won the CP count during that time.
 
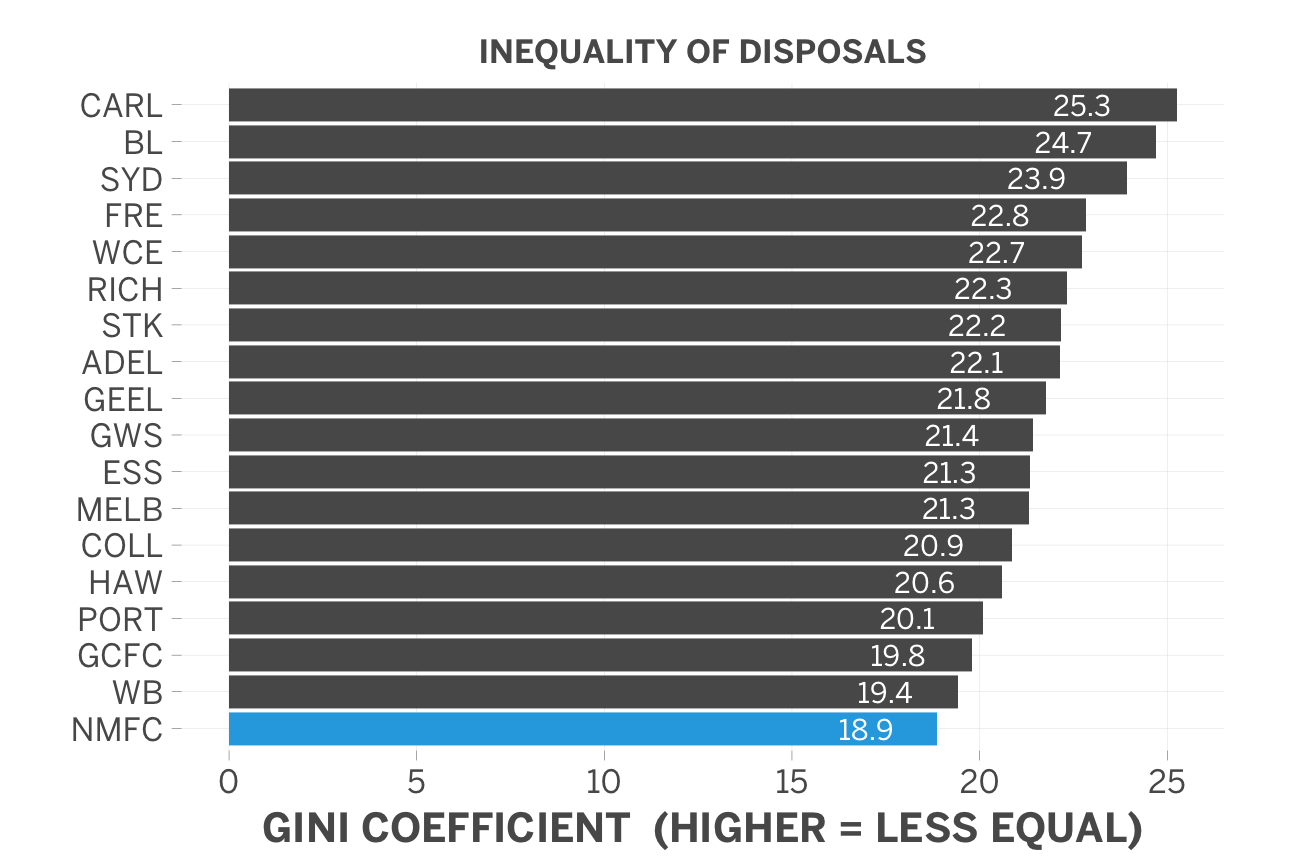
I think this is pretty illustrative graph. We are right up there with Carlton and Brisbane in terms of possession distribution, showing that like clubs heavily rebuilding we really rely on a few players to do the majority of work with the ball. It explains why our form went to s**t so badly at the start of the year with a few of our upper tier in bad form (I believe due to niggles) and a few of our middle tier out.
r214106_1295x863_3-2.png


Probably not unreasonable considering we have gone from one of the oldest and most experienced lists in our premiership year to one with a lot of very youthful players now. We really have been rebuilding on the run and its amazing we have been contenders every year.

I think this is a reflection of our game plan.

I've mentioned this before but our gameplan really can only handle 2 or 3 players not performing at a reasonable level.

Once you start entering the realm of 4+ players having bad games the structures fall away completely.
 

Log in to remove this ad.

Midfield: Clearance kings
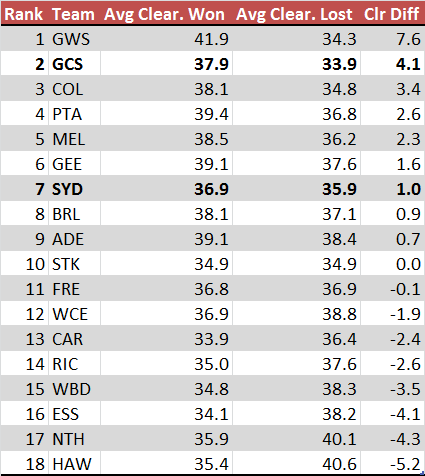
Backed by an in-form quality ruckman in Witts, the Suns have the 2nd highest clearance differential in the competition behind GWS. Ablett leading the way with 7.2 clearances a game is no surprise, but former Adelaide Crow Jarryd Lyons 2nd at the club with 6.6 clearances a game might turn some heads. That ranks him 7th overall in the AFL (on averages) and easily ahead of our 2nd best clearance player in Luke Parker (5.8 clearances a game - ranked 20th).

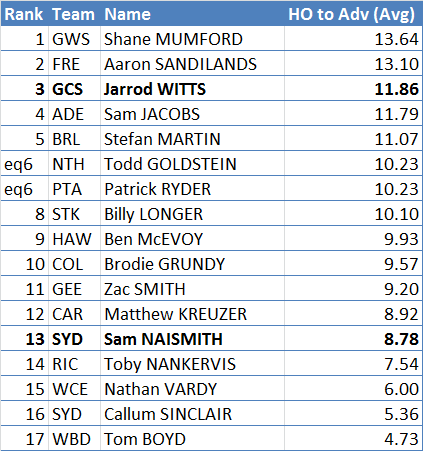
Witts has proved to be a bargain for the Suns at the trade table. Exchange for picks 44 and 62, he has taken over the number 1 ruck mantle from Tom Nicholls and ranks 2nd in the AFL for hitouts to advantage at an average of 11.9 per game, 2nd behind only Mumford (13.6)

Like the Hawks, the Suns like to keep possession of the ball ranking number in the AFL in uncontested possessions and 17th in contested possession rate.

GzL5tDP.png

lWtyW5w.png


Forward: About the Swans' level
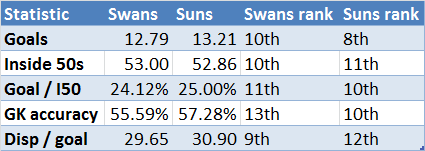
The Swans and Suns have similar offensive stats - both slightly below the AFL average.

xxQfzV0.png


Defence: Swans back to the best, Suns leaky like a sieve
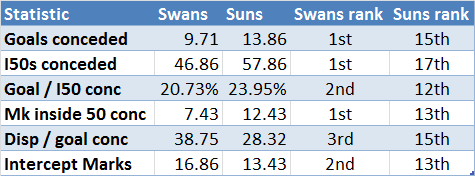
The major differentiation between these two teams comes at the defensive end. The Swans have restored their defensive solidity in the past 7 games while the Suns continue to struggle in preventing teams getting the ball inside their defensive 50 as well as limiting the number of goals resulting from those inside 50s.

Following stats are from Round 7 onwards:
gWTO2jI.png
 
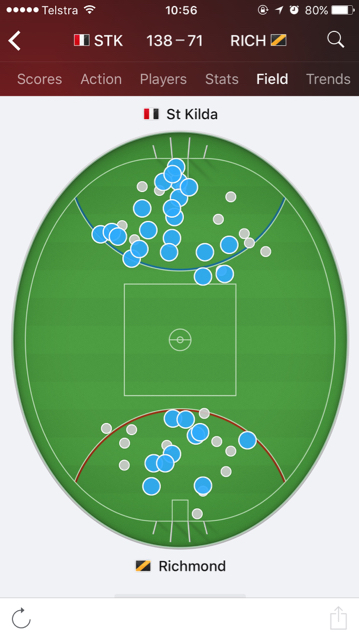
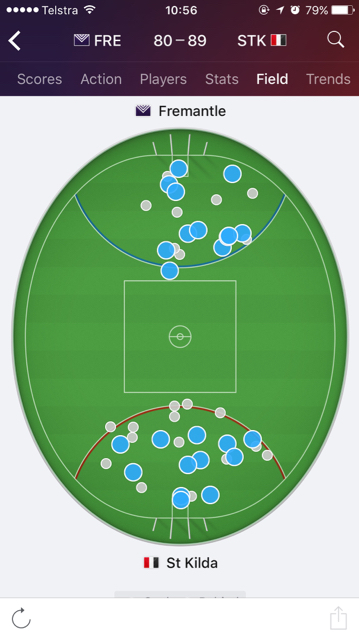
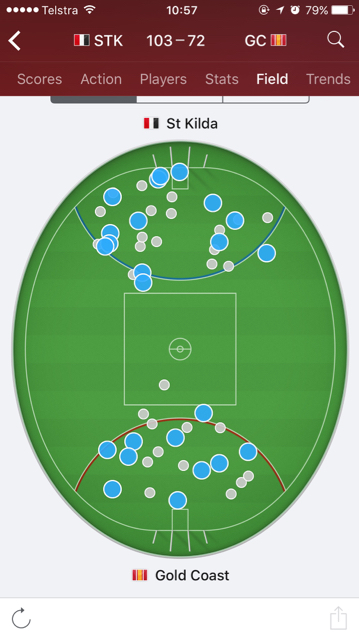
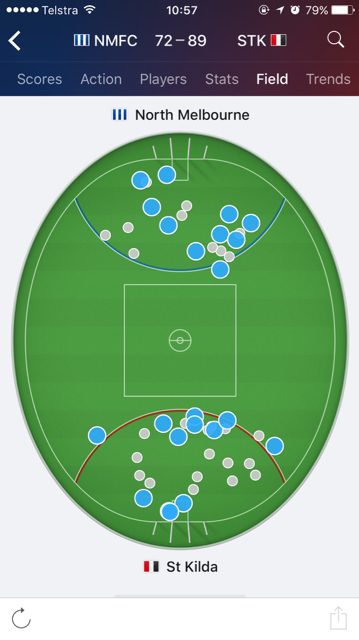
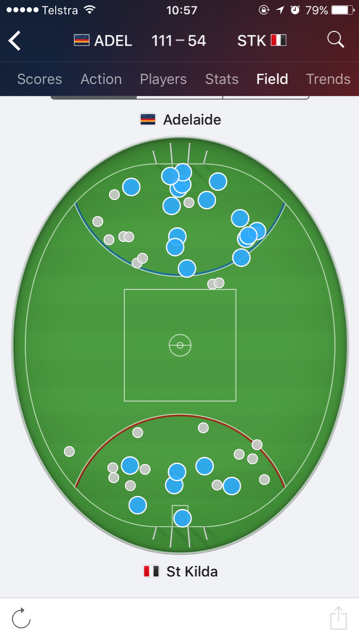
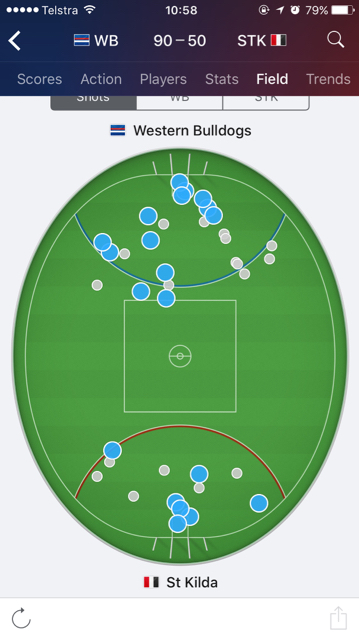
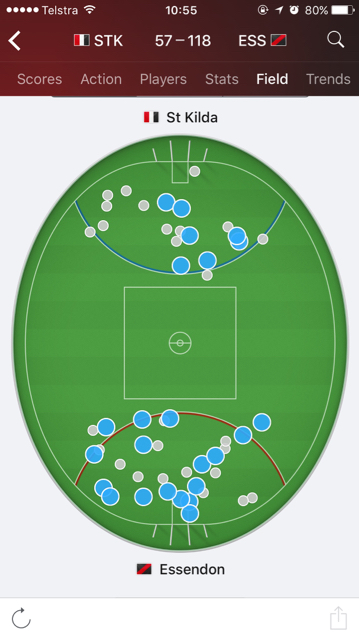
The latest update of the AFL Live app (on iPhone at least, not sure about Android) has tracking metrics available. There's some interesting viewing in there.
 
Midfield: Mumford and his midfielders lead the league

The Giants are the clear number 1 side in clearances, they have the most clearances and conceded the second least number of clearances. The Swans are ranked about mid-table in these stats, but are in the Top 4 in their 8-1 winning run. It all comes to the source, where Mumford leads the league in hitouts to advantage.

The Giants are very clean with their ball use, ranking 1st in Disposal Efficiency (%), Turnovers Conceded and Turnovers Conceded leading to Opposition Goal, and 2nd in Kicking Efficiency (%)

Rank | Player | Hitouts to adv (avg)
\ 1 | Shane MUMFORD (GWS) | 13.2
\2|Aaron SANDILANDS (FRE)|13.1
\3|Max GAWN (MEL)|12.2
\4|Jarrod WITTS (GCS)|12.0
\5|Sam JACOBS (ADE)|11.6
\6|Stefan MARTIN (BRL)|10.8
\7|Tom BELLCHAMBERS (ESS)|10.7
\8|Todd GOLDSTEIN (NTH)|10.6
\9|Billy LONGER (STK)|10.6
\10|Paddy RYDER (PTA)|10.3
\11|Ben McEVOY (HAW)|10.1
\12|Brodie GRUNDY (COL)|9.5
\13|Zac SMITH (GEE)|9.4
\ 14 | Sam NAISMITH (SYD) | 9.2

Clearance Ratio = Clearances for / Clear against * 100
Rank | Team | Clear for (avg) | Clear against (avg) | Clear Ratio
\ 1 | GWS | 41.9 | 34.4 | 1.217
\2|GCS|37.5|34.1|1.102
\3|COL|37.5|34.9|1.074
\4|PTA|39.7|37.0|1.074
\5|GEE|39.6|37.5|1.055
\6|MEL|38.1|36.5|1.044
\ 7 | SYD | 36.9 | 35.6 | 1.036
\8|STK|34.9|34.5|1.010
\9|BRL|38.0|37.7|1.007
\10|FRE|36.5|37.2|0.982
\11|ADE|37.9|38.6|0.981
\12|CAR|34.3|36.1|0.952
\13|WBD|35.3|37.1|0.950
\14|WCE|37.1|39.1|0.947
\15|RIC|34.6|37.4|0.925
\16|NTH|36.3|39.7|0.914
\17|ESS|34.3|37.6|0.911
\18|HAW|35.4|40.6|0.872

Attack: Giants overall very potent, but Swans slightly better over past 9 games
The Giants rank 5th in inside 50s and also goals per inside 50 to come out 3rd in total goals scored. Swans are ranked 8th in total goals scored but over the past 9 games the rankings surge to 2nd ahead of the Giants who still remain in 5th.

While the Swans rely heavily on Buddy, the Giants have a better spread with 6 members in the Top 25 in the league for average score involvements.

Rank | Player | Score Involvements (avg)
\ 1 | Lance FRANKLIN (SYD) | 9.33
\ 2 | Toby GREENE (GWS) | 8.73
\3|Josh J. KENNEDY (WCE)|8.70
\4|Taylor WALKER (ADE)|8.50
\5|Gary ABLETT (GCS)|8.42
\ 6 | Jeremy CAMERON (GWS) | 8.20
\7|Tom T. LYNCH (ADE)|8.08
\8|Dustin MARTIN (RIC)|8.00
\8|Jarrad WAITE (NTH)|8.00
\10|Robbie GRAY (PTA)|7.86
\11|Scott PENDLEBURY (COL)|7.80
\ 12 | Lachie WHITFIELD (GWS) | 7.75
\13|Shaun HIGGINS (NTH)|7.69
\14|Dayne ZORKO (BRL)|7.67
\15|Patrick DANGERFIELD (GEE)|7.53
\15|Joe DANIHER (ESS)|7.53
\17|Taylor ADAMS (COL)|7.47
\17|Eddie BETTS (ADE)|7.47
\19|Tom J. LYNCH (GCS)|7.40
\19|Seb ROSS (STK)|7.40
\ 19 | Callan WARD (GWS) | 7.40
\ 22 | Josh KELLY (GWS) | 7.36
\23|Nick RIEWOLDT (STK)|7.33
\ 24 | Steve JOHNSON (GWS) | 7.27
\ 24 | Luke PARKER (SYD) | 7.27

Defence: Swans on top since Rampe's return
Since Rampe's return to the side in Round 9 against St Kilda, the Swans are ranked number 1 in many key defensive categories including goals conceded, inside 50s conceded, metres gained conceded, score involvements conceded and marks inside 50 conceded, and 2nd in goal assists conceded and goals per inside 50 conceded.

Stat | Swans | Swans Rank | GWS | GWS Rank
\ Goals Conceded (avg) |9.14|1st|12.14|7th
\ Inside 50s Conceded (avg) |46.1|1st|49.9|5th
\ Metres Gained Conceded (avg) |5141.3|1st|5413.3|6th
\ Score Involvements Conceded (avg) |73.4|1st|101.3|10th
\ Marks Inside 50 Conceded (avg) |7.7|1st|11.6|9th
\ Goal Assists Conceded (avg) |5.9|2nd|7.6|5th
\ Goals Per Inside 50 (%) |19.81%|2nd|24.36%|10th
 
Wow. That last table re:defence. I knew we were going well but... :eek: me! 1st overall in some very important, team focused & hard to maintain statistics is a welcome surprise to me!

Things like marks inside 50 show not just great 1on1 efforts but moreso (IMO) the effectivness of structures, pressure & attitude. Those things that win you games.

On %'s, it's likely they'll clear the ball initially out of the middle first more often. So it's up to our midfield to nullify that next possession. I think the most critical area on the ground against the Giants is maintainimg a super-high pressure defensive side of the centre before they attempt to deliver it into the 50.

Gotta be defensive about this one. We can't out gun them IMO.
 
Defence: Swans on top since Rampe's return
Since Rampe's return to the side in Round 9 against St Kilda, the Swans are ranked number 1 in many key defensive categories including goals conceded, inside 50s conceded, metres gained conceded, score involvements conceded and marks inside 50 conceded, and 2nd in goal assists conceded and goals per inside 50 conceded.

Stat | Swans | Swans Rank | GWS | GWS Rank
\ Goals Conceded (avg) |9.14|1st|12.14|7th
\ Inside 50s Conceded (avg) |46.1|1st|49.9|5th
\ Metres Gained Conceded (avg) |5141.3|1st|5413.3|6th
\ Score Involvements Conceded (avg) |73.4|1st|101.3|10th
\ Marks Inside 50 Conceded (avg) |7.7|1st|11.6|9th
\ Goal Assists Conceded (avg) |5.9|2nd|7.6|5th
\ Goals Per Inside 50 (%) |19.81%|2nd|24.36%|10th

Squiggle also has the swans as the best defensive team in the league.

Screen Shot 2017-07-13 at 1.13.22 PM.png
 
Midfield: Mumford and his midfielders lead the league

The Giants are the clear number 1 side in clearances, they have the most clearances and conceded the second least number of clearances. The Swans are ranked about mid-table in these stats, but are in the Top 4 in their 8-1 winning run. It all comes to the source, where Mumford leads the league in hitouts to advantage.

The Giants are very clean with their ball use, ranking 1st in Disposal Efficiency (%), Turnovers Conceded and Turnovers Conceded leading to Opposition Goal, and 2nd in Kicking Efficiency (%)

Rank | Player | Hitouts to adv (avg)
\ 1 | Shane MUMFORD (GWS) | 13.2
\2|Aaron SANDILANDS (FRE)|13.1
\3|Max GAWN (MEL)|12.2
\4|Jarrod WITTS (GCS)|12.0
\5|Sam JACOBS (ADE)|11.6
\6|Stefan MARTIN (BRL)|10.8
\7|Tom BELLCHAMBERS (ESS)|10.7
\8|Todd GOLDSTEIN (NTH)|10.6
\9|Billy LONGER (STK)|10.6
\10|Paddy RYDER (PTA)|10.3
\11|Ben McEVOY (HAW)|10.1
\12|Brodie GRUNDY (COL)|9.5
\13|Zac SMITH (GEE)|9.4
\ 14 | Sam NAISMITH (SYD) | 9.2

Clearance Ratio = Clearances for / Clear against * 100
Rank | Team | Clear for (avg) | Clear against (avg) | Clear Ratio
\ 1 | GWS | 41.9 | 34.4 | 1.217
\2|GCS|37.5|34.1|1.102
\3|COL|37.5|34.9|1.074
\4|PTA|39.7|37.0|1.074
\5|GEE|39.6|37.5|1.055
\6|MEL|38.1|36.5|1.044
\ 7 | SYD | 36.9 | 35.6 | 1.036
\8|STK|34.9|34.5|1.010
\9|BRL|38.0|37.7|1.007
\10|FRE|36.5|37.2|0.982
\11|ADE|37.9|38.6|0.981
\12|CAR|34.3|36.1|0.952
\13|WBD|35.3|37.1|0.950
\14|WCE|37.1|39.1|0.947
\15|RIC|34.6|37.4|0.925
\16|NTH|36.3|39.7|0.914
\17|ESS|34.3|37.6|0.911
\18|HAW|35.4|40.6|0.872

Attack: Giants overall very potent, but Swans slightly better over past 9 games
The Giants rank 5th in inside 50s and also goals per inside 50 to come out 3rd in total goals scored. Swans are ranked 8th in total goals scored but over the past 9 games the rankings surge to 2nd ahead of the Giants who still remain in 5th.

While the Swans rely heavily on Buddy, the Giants have a better spread with 6 members in the Top 25 in the league for average score involvements.

Rank | Player | Score Involvements (avg)
\ 1 | Lance FRANKLIN (SYD) | 9.33
\ 2 | Toby GREENE (GWS) | 8.73
\3|Josh J. KENNEDY (WCE)|8.70
\4|Taylor WALKER (ADE)|8.50
\5|Gary ABLETT (GCS)|8.42
\ 6 | Jeremy CAMERON (GWS) | 8.20
\7|Tom T. LYNCH (ADE)|8.08
\8|Dustin MARTIN (RIC)|8.00
\8|Jarrad WAITE (NTH)|8.00
\10|Robbie GRAY (PTA)|7.86
\11|Scott PENDLEBURY (COL)|7.80
\ 12 | Lachie WHITFIELD (GWS) | 7.75
\13|Shaun HIGGINS (NTH)|7.69
\14|Dayne ZORKO (BRL)|7.67
\15|Patrick DANGERFIELD (GEE)|7.53
\15|Joe DANIHER (ESS)|7.53
\17|Taylor ADAMS (COL)|7.47
\17|Eddie BETTS (ADE)|7.47
\19|Tom J. LYNCH (GCS)|7.40
\19|Seb ROSS (STK)|7.40
\ 19 | Callan WARD (GWS) | 7.40
\ 22 | Josh KELLY (GWS) | 7.36
\23|Nick RIEWOLDT (STK)|7.33
\ 24 | Steve JOHNSON (GWS) | 7.27
\ 24 | Luke PARKER (SYD) | 7.27

Defence: Swans on top since Rampe's return
Since Rampe's return to the side in Round 9 against St Kilda, the Swans are ranked number 1 in many key defensive categories including goals conceded, inside 50s conceded, metres gained conceded, score involvements conceded and marks inside 50 conceded, and 2nd in goal assists conceded and goals per inside 50 conceded.

Stat | Swans | Swans Rank | GWS | GWS Rank
\ Goals Conceded (avg) |9.14|1st|12.14|7th
\ Inside 50s Conceded (avg) |46.1|1st|49.9|5th
\ Metres Gained Conceded (avg) |5141.3|1st|5413.3|6th
\ Score Involvements Conceded (avg) |73.4|1st|101.3|10th
\ Marks Inside 50 Conceded (avg) |7.7|1st|11.6|9th
\ Goal Assists Conceded (avg) |5.9|2nd|7.6|5th
\ Goals Per Inside 50 (%) |19.81%|2nd|24.36%|10th
Naismith is rated as one of the lowest ruckman #14, but Naismith played better (on the day) against #3 Gawn, yet struggle against GCS #4 Witts, yet we won. Also ahead of Naismith is #7 Bellchambers, #8 Goldstein, #9 Langer and we won those games.
Our clearances #7 and we beat the teams #2 GCS and #6.
Ah, the mighty Bloods, defying the odds :)

Our mids setup to shark the taps.
 

(Log in to remove this ad.)

No idea what the percentages mean but given we were crap for half the games, that's a pretty sizable gap over the 2nd placed team

I'm shocked that Collingwood were ranked 1st across the previous 2 year! :eek:
 
Hey grimlock, would you be able to access pressure act stats? Was wondering if we've had a significant increase from R1-6 and R7-16 and which players have been leading it.
 
Wow. That last table re:defence. I knew we were going well but... :eek: me! 1st overall in some very important, team focused & hard to maintain statistics is a welcome surprise to me!
Things like marks inside 50 show not just great 1on1 efforts but moreso (IMO) the effectivness of structures, pressure & attitude. Those things that win you games.

On %'s, it's likely they'll clear the ball initially out of the middle first more often. So it's up to our midfield to nullify that next possession. I think the most critical area on the ground against the Giants is maintainimg a super-high pressure defensive side of the centre before they attempt to deliver it into the 50.

Gotta be defensive about this one. We can't out gun them IMO.
Someone needs to dodge like a bullfighter, the inevitable Mummy shoulder charge and get Mummy to clean up Toby Greene in the follow through instead.
 
Cloud_

The numbers might surprise you as it did me, but unless we have a better understanding of what a pressure act is and how it is actually measured we probably can't conclude too much from these numbers.

Rounds 1-6
SYD 299.2 5th
GWS 306.67 3rd

R.Fox 20.67
D.Hannebery, L.Parker 20.00
G.Hewett 19.00
H.Cunningham 18.80
J.Kennedy 18.33
K.Jack 17.20
J.Foote 16.25
O.Florent 17.00
Z.Jones 15.83

Rounds 7-16
SYD 294.6 15th
GWS 337.3 1st

J.Kennedy 23.13
T.Papley 21.11
I.Heeney 20.22
L.Parker 20.00
K.Jack 18.00
D.Hannebery 17.56
G.Hewett 17.00
Z.Jones 16.38
W.Hayward 15.43
H.Cunningham 15.00
 
That does leave me surprised. Pressure acts equate to the number of times a player closes, corals, chases, or applies physical pressure on the opposition. I would have thought this would have improved from the first 6 rounds considering how easily opponents seemed to be transitioning the ball from defense to the forward line.

But perhaps it's dropped off as a result of our time in possession improving significantly from the start of the year meaning we have less opportunity to apply pressure.
 
St Kilda

Strengths: Pressure, pressure, pressure

The Saints lead the AFL in pressure acts and with their employment of an aggressive forward press. They are particularly proficient at locking the ball inside their forward 50, averaging the 4th most tackles inside 50. This has protected their average defensive unit by defending higher up the ground by conceding the 3rd least inside 50s in the competition.

Rank | Team | Tackles Inside 50 (Avg)
\1st|Geelong|14.4
\2nd|Richmond|13.9
\3rd|Port Adelaide|13.7
\ 4th | St Kilda | 13.1
\5th|Melbourne|13.0
\ 6th | Sydney | 12.6
\7th|Collingwood|12.5
\8th|West Coast|12.4
\9th|Western Bulldogs|12.4
\10th|Adelaide|12.3
\11th|North Melbourne|12.1
\12th|Carlton|11.5
\13th|GWS|11.3
\14th|Brisbane|11.2
\15th|Hawthorn|11.1
\16th|Gold Coast|10.6
\17th|Essendon|9.8
\18th|Fremantle|8.1

Rank | Team | Pressure Acts (Avg)
\ 1st | St Kilda | 325.0
\2nd|Hawthorn|320.8
\3rd|Adelaide|317.9
\4th|Western Bulldogs|308.8
\5th|North Melbourne|304.8
\6th|Melbourne|304.8
\7th|Fremantle|302.0
\8th|Geelong|300.3
\9th|Carlton|300.2
\10th|Richmond|299.4
\ 11th | Sydney | 299.1
\12th|West Coast|299.0
\eq 13th|Collingwood|294.9
\eq 13th|Gold Coast|294.9
\15th|Port Adelaide|293.1
\16th|GWS|286.8
\17th|Essendon|284.9
\18th|Brisbane|283.0


Jack Steele leads the way for the Saints in this area, with his averages of 25.93 pressure acts a game (4th) and 7.71 tackles (equals 4th) elite in the AFL which was why it was so confusing that the Saints dropped him earlier in the year

Rank | Player | Tackles (Avg)
\1st|Scott Selwood (GEE)|11.80
\2nd|Rory Sloane (ADE)|8.00
\3rd|Tom Liberatore (WBD)|7.83
\eq 4th|Hugh Greenwood (ADE)|7.71
\ eq 4th | Jack Steele (STK) | 7.71
\eq 6th|Dayne Zorko (BRL)|7.50
\eq 6th|Brad Ebert (PTA)|7.50
\9th|Jack Viney (MEL)|7.43
\10th|Matt Priddis (WCE)|7.27

Rank | Player | Pressure Acts (Avg)
\1st|Tom Liberatore (WBD)|27.67
\2nd|Dayne Zorko (BRL)|27.56
\3rd|Hugh Greenwood (ADE)|26.57
\ 4th | Jack Steele (STK) | 25.93
\5th|Tom Mitchell (HAW)|24.75
\6th|Liam Shiels (HAW)|24.44
\7th|Scott Selwood (GEE)|24.40
\8th|Brad Ebert (PTA)|24.00
\9th|Rory Sloane (ADE)|23.94
\10th|Josh Kelly (GWS)|23.75

Weaknesses: Goalkicking accuracy

The Saints are the least accurate goalkicking side in the AFL, and in particular have struggled with their conversion in recent weeks. In 6 of their past 7 games they have tallied more behinds than goals (80 goals 100 behinds) with their biggest culprits in this period being Jack Steven (3.11), Jack Lonie (2.7), Jack Billings (6.11), Mav Weller (1.5), Jade Gresham (7.9) and Nick Riewoldt (7.8). The one exception has been Tim Membrey (11.2) but of course he is suspended for this game.

Last time we met
One of the concerns going into the Round 9 match this year was how the Swans were going to contain the outside game style and outside run of the Saints. The Swans ended up matching the Saints in the uncontested areas of the game - although we conceded a season high 292 uncontested possessions that day, we also racked up a season high 288 ourselves. But more tellingly we had a season high 120 uncontested marks on the day.
 
Love your work grimlock! Thanks again for this.

My biggest concern is if the Saints kick straight. They have no problem getting shots or possession it seems... We need to push them wide in the deep fwd pocket as much as we can IMO. Limit easy shots on goal & hopefully their lack of goal kicking confidence will do the rest.
 

Remove this Banner Ad

Back
Top