Politics Climate Change Paradox (cont in part 2)

Should we act now, or wait for a unified global approach


  • Total voters
    362

Remove this Banner Ad

Status
Not open for further replies.
There has been some warming since 1998 but much less than the models based on anthropogenic warming indicated. It's plausible that the small rise in temperature was due to natural variability and there has been an overestimation in the models of sensitivity to elevated greenhouse gas concentrations.

surely you appreciate that using 1998 as a reference point in this fashion is a really poor way to approach the issue? i'll explain further if you want, but i would've thought you'd already know such basics?

Love the talk of science here. Its strange how science matters here but not for GM foods, coal seam gas or even how many genders there are.

there are about 5 threads on GMOs on bigfooty that i am aware of. think i've posted in all of them ;)
 
surely you appreciate that using 1998 as a reference point in this fashion is a really poor way to approach the issue? i'll explain further if you want, but i would've thought you'd already know such basics?


there are about 5 threads on GMOs on bigfooty that i am aware of. think i've posted in all of them ;)
Cancer causing food ;)
 
surely you appreciate that using 1998 as a reference point in this fashion is a really poor way to approach the issue? i'll explain further if you want, but i would've thought you'd already know such basics?

I cited temperature records since 1870. There have been three significant warming periods since then. However the IPCC makes its case for anthropogenic warming just for the period 1975-1998. That's a really poor way to approach the issue.

To some extent the IPCC uses 1998 as a reference point. AR5 cites that

all global combined LSAT and SST data sets exhibit a statistically non-significant warming trend over 1998–2012 (0.042°C ± 0.093°C per decade (HadCRUT4); 0.037°C ± 0.085°C per decade (NCDC MLOST); 0.069°C ± 0.082°C per decade (GISS)). An average of the trends from these three data sets yields an estimated change for the 1998–2012 period of 0.05 [–0.05 to +0.15] °C per decade.​

This basically means there has been no significant rise in temperatures during that period. They go on to say (and maybe this is your point)

Trends of this short length are very sensitive to the precise period selection with trends calculated in the same manner for the 15-year periods starting in 1995, 1996, and 1997 being 0.13 [0.02 to 0.24], 0.14 [0.03 to 0.24] and 0.07 [–0.02 to 0.18] (all °C per decade), respectively.​

This is fairly basic revisionism. Their models made these predictions that were the basis for global emissions policies and they have failed. The IPCC do not have validated models that justify their radical political policies.
 

Log in to remove this ad.

Leading climate scientist Judith Curry.

"I don't think that even if we had the political will we could do very much to change the climate. Carbon dioxide is not a control knob for the climate. It has some effect on very long time scales but it is nothing you can really dial up or down on the time scale of a century and change the climate. There's a lot of natural forces in play here that determine the climate and thinking that we can really control the climate by dialling down the CO2 emissions is really misguided hubris ".

https://www.heraldsun.com.au/blogs/...e/news-story/bb35a20b8e349334dfcd8ff5191a7d81

Face it guys the world warms naturally, that is how we have come out of multiple ice ages.
 
Lol. Humanity has little chance with recalcitrants like you gambling with our future.

Despite over 98% of published papers and mountains of evidence, both direct and indirect, we still have people actively trying to hinder humanity reaching a solution to this incoming catastrophe. This is why we have little chance of dealing with this situation.

I know, it's the feels. The solutions to this crisis dont fit in with your political ideology so you just deny reality and generate a narrative that science is somehow left wing.

Instead of this being a critisicm of science, it is a confirmation of progressive/left politics. Our best method of analyzing and understanding the world around us continues to lead towards leftism.
 
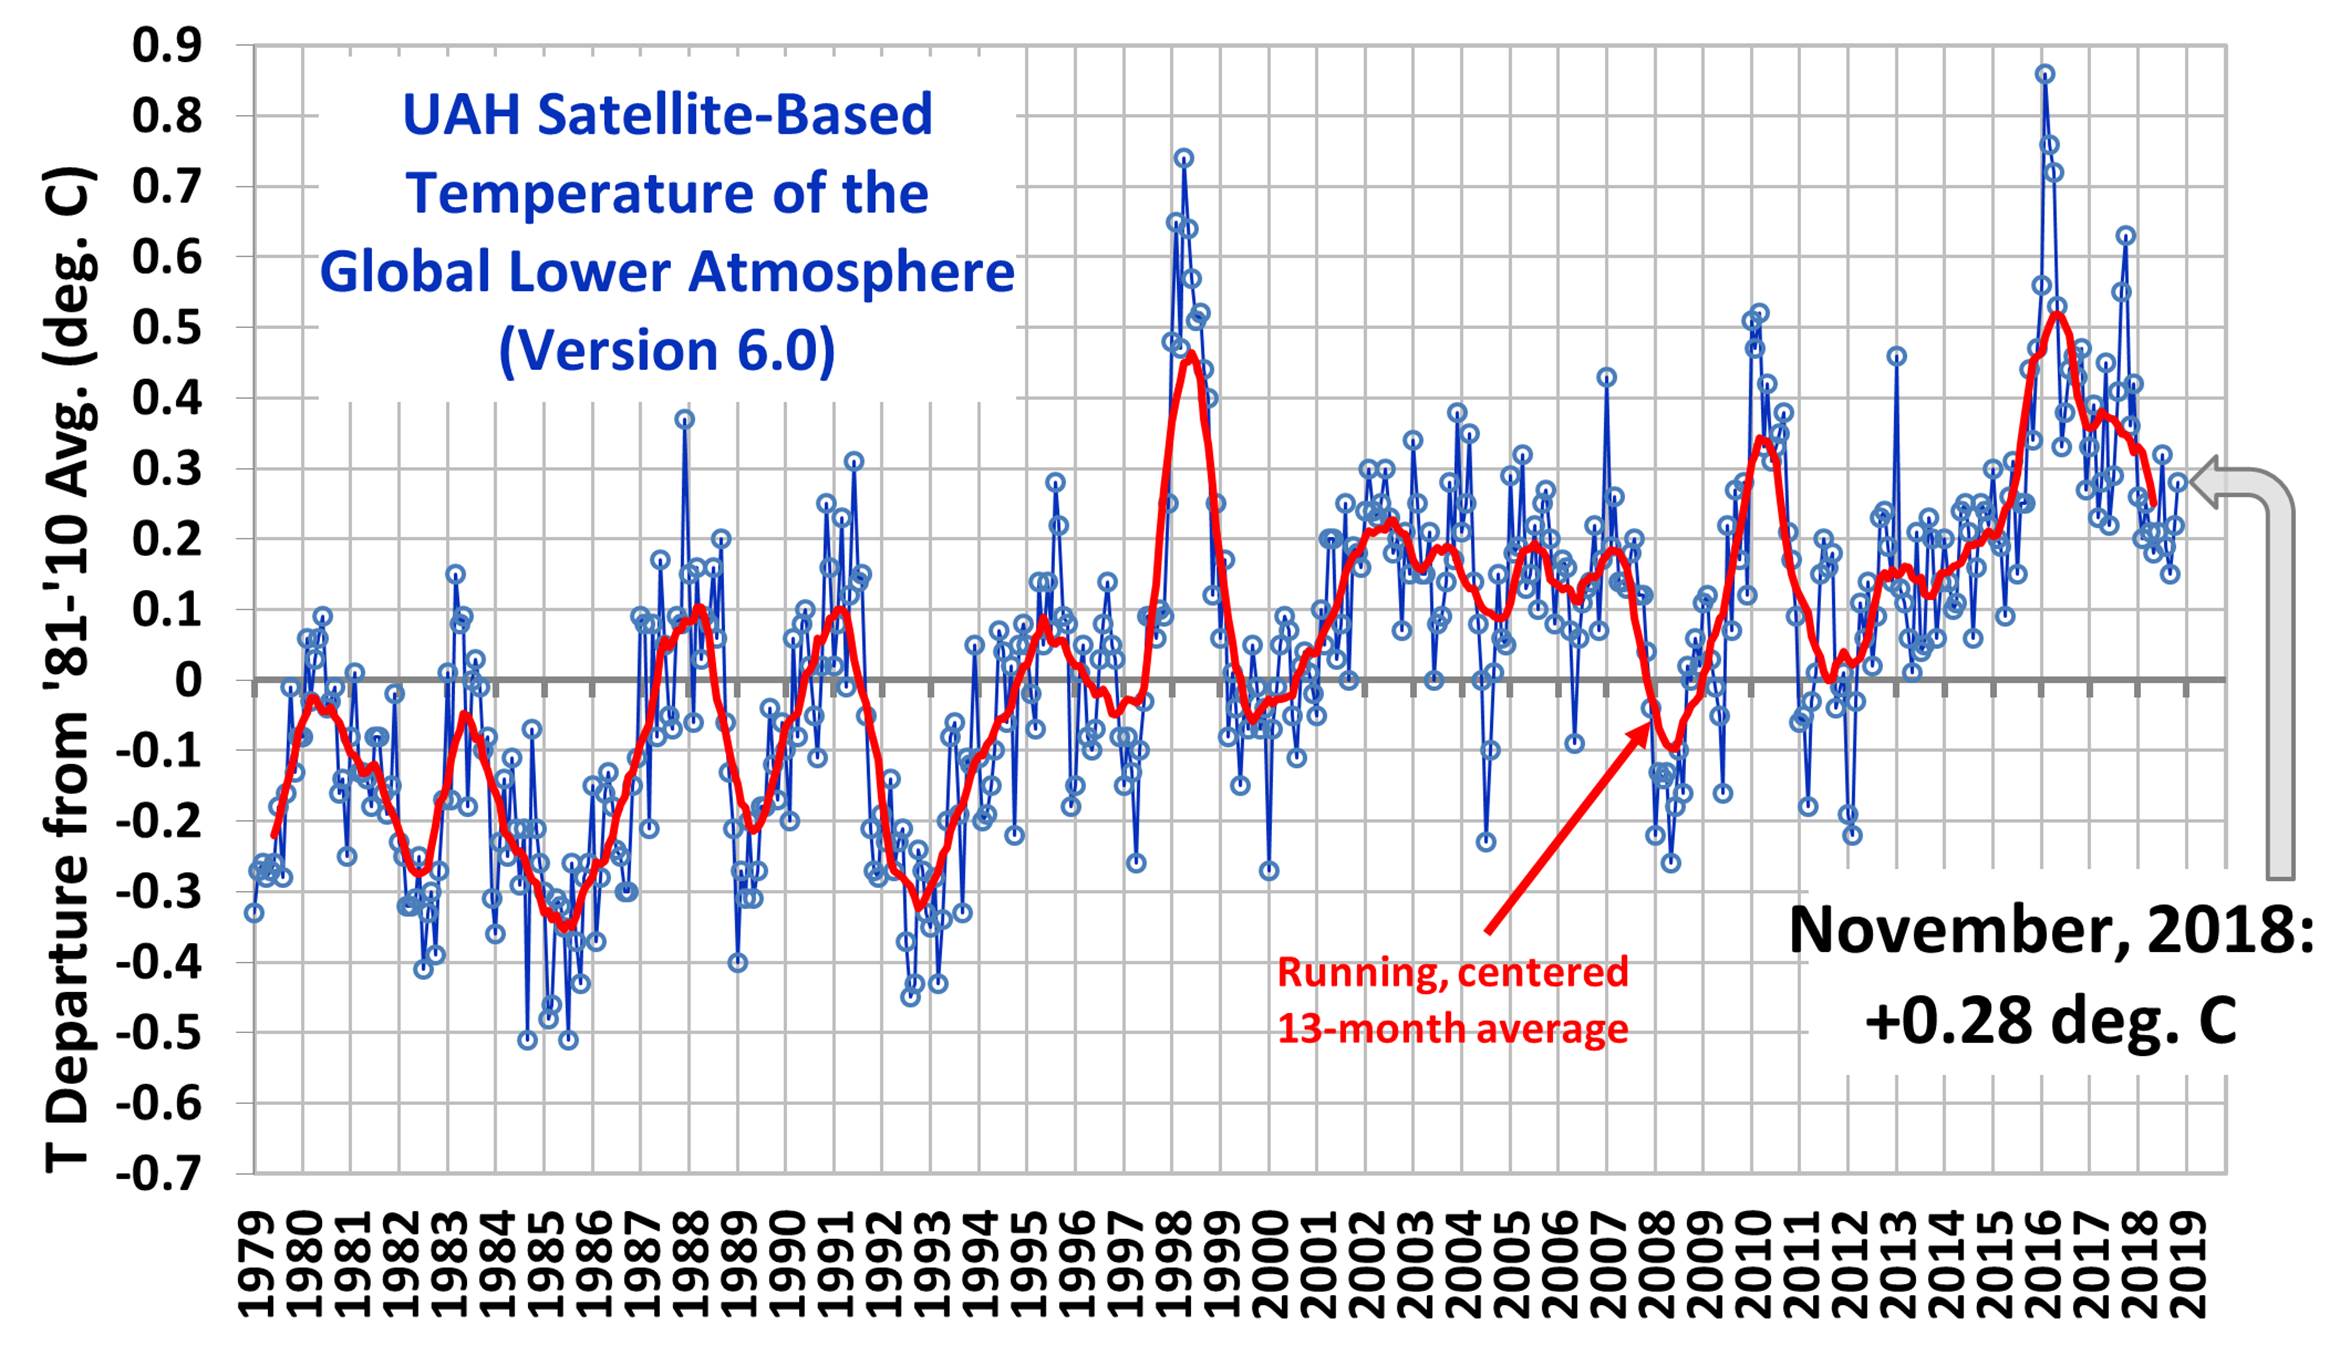
Global temps as per NOAA satellites
UAH_LT_1979_thru_November_2018_v6.jpg


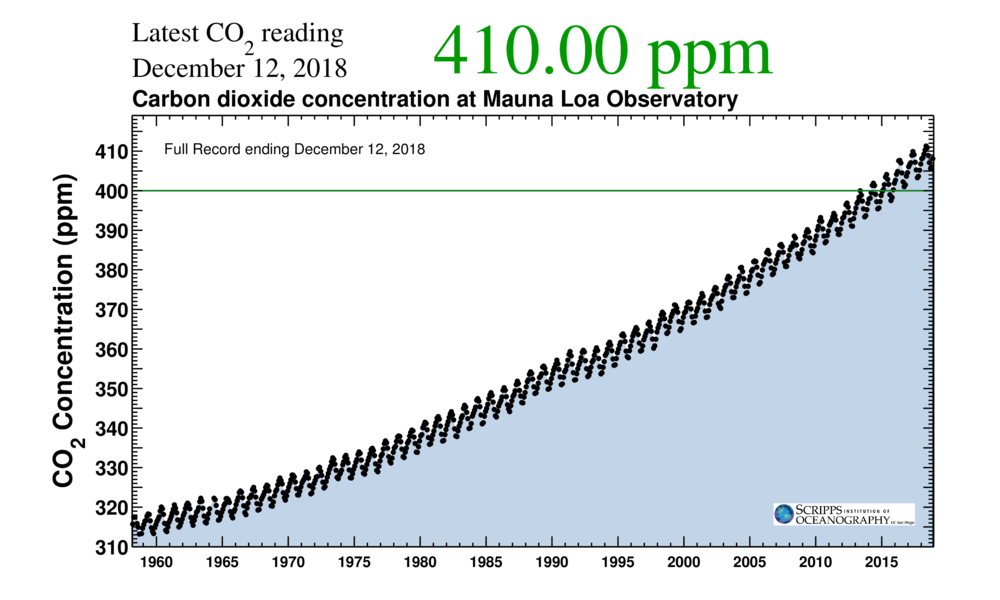
Atmospheric CO2 concentration

mlo_full_record.png

Not expecting anyone to draw sweeping conclusions from the above charts. But come on, at least question the narrative some of you are regurgitating.
 
Yep, graphs above show that it is steadily warming with typical climatic swings. Of course, if you take into account all known climate forcings the world should have been getting colder over the last 40 years, but it isn't. Strange that! The other thing is that most people are clearly misunderstanding what happens in dynamic and chaotic systems, like the climate. Certain forcings can seem to cause a linear disturbance to the status quo, but eventually, cause something else to change. A great example of this is the end of the last ice age. Melting of the northern glaciers led to an increase in warming at first, then a rapid cooling as the cold water from the glaciers changed the temperature of the water. Then the march of warming continued.

In this case, we have more warming feedbacks to go. The thawing of northern tundra is leading to an increase in Co2 and Methane which will accelerate the warming. We have also seen the ocean take up a lot of the warming and absorb a lot of the Co2. As the ocean warms it soaks up less of the Co2.

... and anti-GMO people are just pricks. What is wrong with GMOs? Is there anything that we eat that isn't? Engineering plants that use less natural resources, require fewer pesticides, provide a wider range of nutrients for the world's poor. Sorry does that get in the way of a few hippies feels? Ultimate white privileged campaigners.
 
Leading climate scientist Judith Curry.

"I don't think that even if we had the political will we could do very much to change the climate. Carbon dioxide is not a control knob for the climate. It has some effect on very long time scales but it is nothing you can really dial up or down on the time scale of a century and change the climate. There's a lot of natural forces in play here that determine the climate and thinking that we can really control the climate by dialling down the CO2 emissions is really misguided hubris ".

https://www.heraldsun.com.au/blogs/...e/news-story/bb35a20b8e349334dfcd8ff5191a7d81

Face it guys the world warms naturally, that is how we have come out of multiple ice ages.

Judith Curry is an interesting case. She is indeed a leading climate researcher and she takes a skeptical approach to climate change predictions. And, for the most part, her analysis is good (although at times she has used more aggressive denialist talking points that have been thoroughly discredited, but not necessarily in bad fsith). Mostly, her case is that the models make large assumptions, predictions might be wrong, and we don't really 'know what will happen.

And you know what - she is probably right. The models aren't perfect - that's science!

The problem is that those models are the best, most rigorous models we have. They synthesize the best available science, to give the best possible prediction, based on the work of hundreds and thousands of people over a half century.

To me, there is a time and place for skepticism, and a time and place for acting based on the balance of probabilities and risk analyses. If a bloke pulls a knife on you in a dark alley, you don't 'know" for certain he is going to stab you. But it makes sense to run. With climate science, we really don't know what will happen. But the predictions are the best available, and are pretty alarming. They have also held up.to scrutiny and across time pretty well. That suggests some form of action is prudent. Particularly given the long term benefits of converting to renewable energy that have nothing to do with climate (potentially cheaper, healthier, and better geopolitically)
 
Yep, graphs above show that it is steadily warming with typical climatic swings.

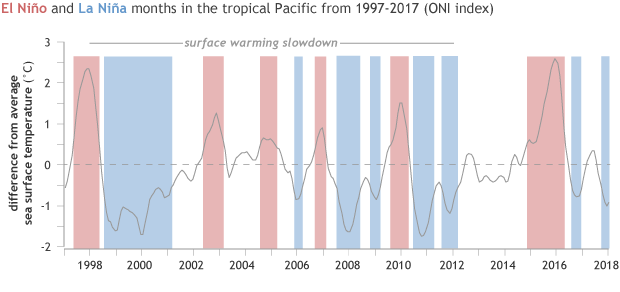
Have another look. 2016 El Nino-driven spike aside, there has been negligible net temperature increase since early this century. Yet new CO2 emission records are set every year. At the very least, the relationship (if there is one) between CO2 levels and temperature is far more complex than the pro-warming crowd suggests. But that goes without saying.

"Global ocean temperature" is difficult to measure; the level of uncertainty is greater than the measurements themselves. The proposal being presented is to direct trillions of dollars towards a "best guess" ballpark scenario favoured by a majority of climate scientists, which may or may not have a discernible impact. Gambling on a colossal scale, if you will. No wonder the wave of climate optimism is "broken and tumbling", according to David Attenborough recently.

No opposition to renewables from me, once the implementation cost becomes practical, but after starting out on the pro-warming side of the debate and taking a closer look following Climategate ("if this thing is so obvious, why do they need to fudge?"), the evidence and the state of renewable technology suggests further observation is pertinent at this stage. Scientists from various fields are approaching the issue from different angles, e.g. some solar scientists insist we are entering a grand solar minimum which will result in a decrease in the solar wind -> increase in interstellar rays hitting the atmosphere -> increased cloud -> drop in temperature. I don't believe any one person has the answers; our current level of understanding is too sketchy.

We can measure the radiation arriving and leaving earth. That shows an underlying non-linear increase in the temperature, which is happening at a speed that is unheard of in any paleoclimate reconstructions. The other thing is that if we keep emitting Co2 we will change the composition of the atmosphere and have an immediate 1 degree Celcius increase in temp.

earth_temperature_timeline.png
A52CE757-EE05-45ED-846C-179D859881A6.gif
 
Then the march of warming continued.

ONI_1995-2018_colorblocked_620.gif


As the ocean warms it soaks up less of the Co2.

Still under investigation and possibly wrong.

It has been speculated that the partial pressure of carbon dioxide (pCO2) in shelf waters may lag the rise in atmospheric CO2. Here, we show that this is the case across many shelf regions, implying a tendency for enhanced shelf uptake of atmospheric CO2. This result is based on analysis of long-term trends in the air–sea pCO2 gradient (ΔpCO2) using a global surface ocean pCO2 database spanning a period of up to 35 years. Using wintertime data only, we find that ΔpCO2increased in 653 of the 825 0.5° cells for which a trend could be calculated, with 325 of these cells showing a significant increase in excess of +0.5 μatm yr−1 (p < 0.05). Although noisier, the deseasonalized annual data suggest similar results. If this were a global trend, it would support the idea that shelves might have switched from a source to a sink of CO2 during the last century.

https://www.nature.com/articles/s41467-017-02738-z
 
ONI_1995-2018_colorblocked_620.gif


Still under investigation and possibly wrong.

It has been speculated that the partial pressure of carbon dioxide (pCO2) in shelf waters may lag the rise in atmospheric CO2. Here, we show that this is the case across many shelf regions, implying a tendency for enhanced shelf uptake of atmospheric CO2. This result is based on analysis of long-term trends in the air–sea pCO2 gradient (ΔpCO2) using a global surface ocean pCO2 database spanning a period of up to 35 years. Using wintertime data only, we find that ΔpCO2increased in 653 of the 825 0.5° cells for which a trend could be calculated, with 325 of these cells showing a significant increase in excess of +0.5 μatm yr−1 (p < 0.05). Although noisier, the deseasonalized annual data suggest similar results. If this were a global trend, it would support the idea that shelves might have switched from a source to a sink of CO2 during the last century.

https://www.nature.com/articles/s41467-017-02738-z
How is it wrong? As water warms it’s ability to hold gas decreases. Always return to the first principles.
 

(Log in to remove this ad.)

We can measure the radiation arriving and leaving earth. That shows an underlying non-linear increase in the temperature, which is happening at a speed that is unheard of in any paleoclimate reconstructions. The other thing is that if we keep emitting Co2 we will change the composition of the atmosphere and have an immediate 1 degree Celcius increase in temp.

Yes I saw that graphic when it was first published. Quite obviously it has been drawn for effect, is not to scale, and has been liberally "smoothed". The degree of warming and rate of temperature increase during the Medieval Warm Period a thousand years ago were comparable to today. The temperature fall during the Little Ice Age is depicted conservatively, and there was a rapid increase early in the 18th century (about 0.4 degrees, not shown).

Every six years the IPCC releases a report warning we are approaching a "tipping point" and cries that we must sell the farm immediately, while subsequent observations hose down the message. I doubt there are very many alarmists in climate science ranks, with Guy McPhersons being singularly rare, but the UN has hijacked the science and is driving the narrative for political ends.
 
Last edited:
Something Living At The Bottom Of The Sea Is Absorbing Large Amounts Of The CO2 In Oceans

By Madison Dapcevich

21 Nov 2018, 23:03

Bacteria living more than 4,000 meters (2.5 miles) below the surface of the Pacific Ocean are absorbing an estimated 10 percent of the carbon dioxide that oceans remove from the atmosphere every year.

The team "discovered that benthic bacteria are taking up large amounts of carbon dioxide and assimilating it into their biomass through an unknown process. This was completely unexpected,” said study author Andrew Sweetman in a statement. "Their biomass then potentially becomes a food source for other animals in the deep sea, so actually what we've discovered is a potential alternative food source in the deepest parts of the ocean, where we thought there was none."

Writing in Oceanography and Limnology, the researchers say benthic bacteria, rather than seafloor animals, could be the “most important organisms” consuming organic waste that floats down towards the ocean floor.

To examine the cellular processes of benthic organisms, the team analyzed sediment samples taken from an area in the eastern Pacific Ocean between Hawaii and Mexico known as the Clarion-Clipperton Fracture Zone (CCFZ), a deep-sea ecosystem completely void of light but for flashes of bioluminescence and with a surprisingly biodiverse seabed environment. Bacteria here “dominated the consumption” of organic waste over just one or two days. When scaling their results, that equates to about 200 million tonnes of carbon dioxide that could be fixed into biomass every year, making the region a potentially important fixture in the deep-sea carbon cycle.

"We found the same activity at multiple study sites separated by hundreds of kilometres, so we can reasonably assume this is happening on the seabed in the eastern CCFZ and possibly across the entire CCFZ,” said Sweetman.

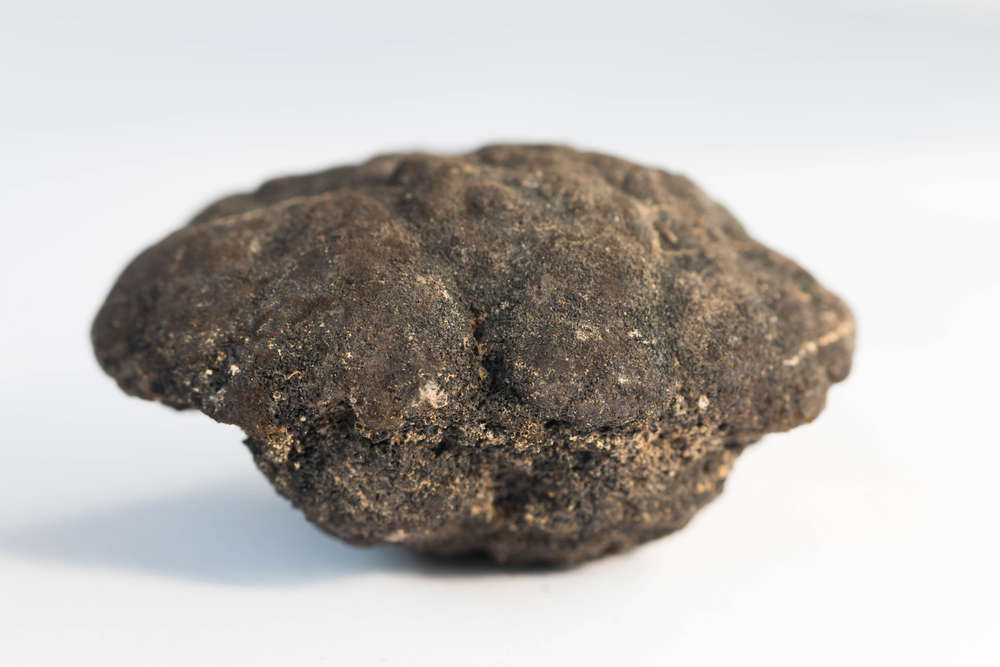
content-1542828128-shutterstock-246929305.jpg

Polymetallic nodules from 5000 meters below the surface of the Pacific ocean.

The CCFZ is home to more than just deep-sea sponges, sea anemones, shrimps, and octopods. The clay-like muddy bottom is topped with trillions of potato-sized polymetallic nodules containing deposits of nickel, manganese, copper, zinc, cobalt, and other minerals, according to Pew Charitable Trusts. It’s an area so rich in minerals that the International Seabed Authority has awarded 16 exploration contracts for groups interested in conducting surveys for future seabed mining.

Assuming the results can be applied to the greater CCFZ, the authors say their findings could have implications for mineral extraction in this region.

"If mining proceeds in the CCFZ, it will significantly disturb the seafloor environment,” said Sweetman. “Just four experiments similar to ours have been conducted in situ in the abyssal regions of the oceans; we need to know much more about abyssal seafloor biology and ecology before we even consider mining the region.”

https://www.iflscience.com/environm...a_Z2Iwc03uNbgjJZFA-ECdjLNto-yI_wW7Acb4dS5LQes
 
Yes I saw that graphic when it was first published. Quite obviously it has been drawn for effect, is not to scale, and has been liberally "smoothed". The degree of warming and rate of temperature increase during the Medieval Warm Period a thousand years ago were comparable to today. The temperature fall during the Little Ice Age is depicted conservatively, and there was a rapid increase early in the 18th century (about 0.4 degrees, not shown).

Every six years the IPCC releases a report warning we are approaching a "tipping point" and cries that we must sell the farm immediately, while subsequent observations hose down the message. I doubt there are very many alarmists in climate science ranks, with Guy McPhersons being singularly rare, but the UN has hijacked the science and is driving the narrative for political ends.

That graphic shows worldwide averages. Not localised events, like the medieval warming. The levels of possible variation from the reconstruction shown are talked about at the start of the graphic. It is to scale. Why did you say it isn't? Of course, it was made to an effect. It puts the last 50 years into perspective. We just don't see events like this in the past. Without the impact of modern human technology (please don't distinguish between "natural" or not because we're part of the natural world and whatever we do is "natural") there is nothing other than collisions from large objects, not part of earth, that can cause this drastic change.

I have worked with this sort of statistics. Of course, you smooth out the data. Especially in something as circular as weather and climate, we do something like a Fourier Transform and look for underlying signals.

I agree that many political movers and shakers have hijacked the science. However, they have done so to minimise the danger we are facing because they are part of the current wealthy establishment that stand to lose a lot of money when we transition our energy sources.

As stated earlier, there is no record of anything like this in the geological record that didn't involve an asteroid or similar. I doubt very much that ecological systems will cope with this shock. It only took 5 degrees warming in 5 millennia to then trigger another 5 degrees warming of the following 5 millennia to cause the worst extinction event in earth's history.

Like a frog in a jacuzzi.

"Localised event" doesn't do it justice; temperatures outside the equatorial zone rose abruptly in both hemispheres, even if more recent IPCC charts have de-fanged both the MWP and the Little Ice Age.

main-qimg-6a72a5e43e4f16fe2271e939f6bff44c


I'm not seeing the temperature fall two degrees from the height of the MWP in the large graphic; more like half a degree. Nor the sharp rise in the early 18th century as mentioned previously.

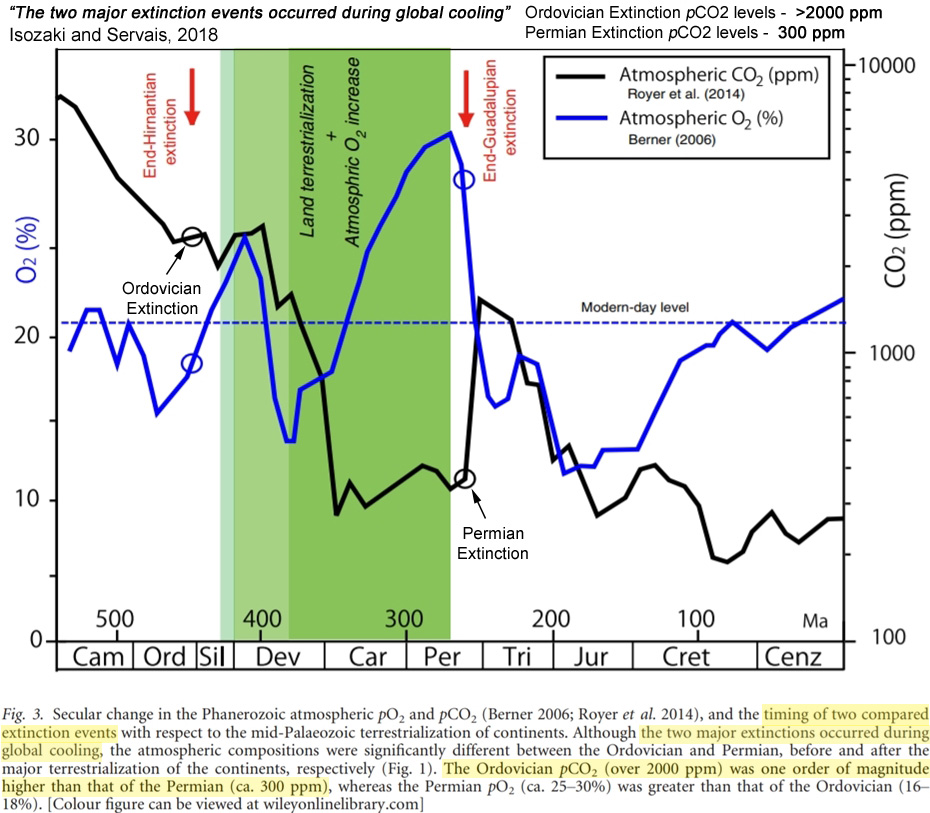
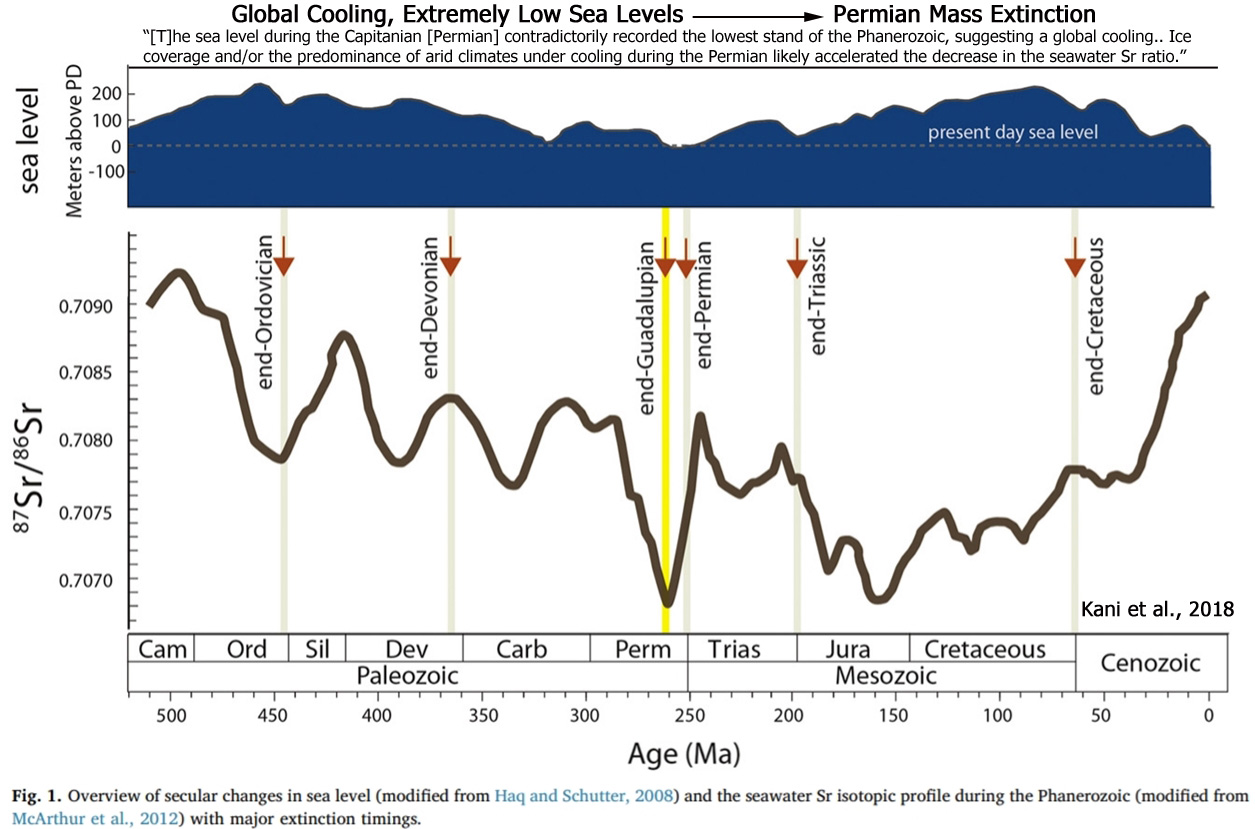
Recent research suggests the Permian-Triassic extinction (assuming that's what you're referring to) occurred after a drop in sea level, which points to large-scale glaciation/cooling.

Permian-Extinction-Coincided-With-300-ppm-CO2-Isozaki-Servais-2018.jpg


Cooling-and-Low-Sea-Levels-Caused-Permian-Mass-Extinction-Kani-2018.jpg
 
How Earth sheds heat into space

Vishal Tiwari Tuesday, September 25, 2018

MIT scientists have discovered the appropriate response, alongside a forecast for when this linear relationship will break down. They saw that Earth emanates heat to space from the planet’s surface and additionally from the atmosphere.

The Earth sheds more heat into space as its surface heat up. In 1950, scientists observed a straightforward clear, linear connection between the Earth’s surface temperature and its active heat. As the earth is extremely messy system, with many complicated, interacting parts that can affect this process, it is difficult for scientists to explain why this relationship between surface temperature and outgoing heat is so simple and linear. Now, MIT scientists have discovered the appropriate response, alongside a forecast for when this linear relationship will break down. They saw that Earth emanates heat to space from the planet’s surface and additionally from the atmosphere. As both heat up, say by the expansion of carbon dioxide, the air holds more water vapor, which thusly acts to trap more heat in the air.

This strengthening of Earth’s greenhouse effect is known as water vapor feedback. Crucially, the team found that the water vapor feedback is just sufficient to cancel out the rate at which the hot atmosphere emits more heat into space. The general change in Earth’s produced heat therefore just relies upon the surface. Thus, the discharge of heat from Earth’s surface to space is a simple function of temperature, prompting to the observed linear relationship. The study in other words may also help to explain how extreme, hothouse climates in Earth’s ancient past unfolded.

During the study, scientists constructed a radiation code — basically, a model of the Earth and how it transmits heat, or infrared radiation, into space. The code reproduces the Earth as a vertical column, beginning from the ground, through the environment, lastly into space. Scientists can input a surface temperature into the section, and the code figures the measure of radiation that breaks through the whole column and into space. The team can then turn the temperature knob up and down to see how different surface temperatures would affect the outgoing heat. When they plotted their data, they observed a straight line — a linear relationship between surface temperature and outgoing heat, in line with many previous works, and over a range of 60 kelvins, or 108 degrees Fahrenheit. Daniel Koll, MIT’s Department of Earth, Atmospheric and Planetary Sciences (EAPS) said, So the radiation code gave us what Earth actually does, Then I started digging into this code, which is a lump of physics smashed together, to see which of these physics is actually responsible for this relationship."

For this, scientists programmed into their code various effects in the atmosphere, such as convection, and humidity, or water vapor, and turned these knobs up and down to see how they in turn would affect the Earth’s outgoing infrared radiation.We needed to break up the whole spectrum of infrared radiation into about 350,000 spectral intervals because not all infrared is equal," said Koll. "While water vapor does absorb heat or infrared radiation, it doesn’t absorb it indiscriminately, but at wavelengths that are incredibly specific, so much so that the team had to split the infrared spectrum into 350,000 wavelengths just to see exactly which wavelengths were absorbed by water vapor.”

Scientists observed that as the Earth’s surface temperature gets hotter, it basically needs to shed more heat into space. And yet, water vapor develops and acts to ingest and trap heat at specific wavelengths, making a greenhouse impact that keeps a small amount of heat from getting away. Koll said, It’s like there’s a window, through which a river of radiation can flow to space. The river flows faster and faster as you make things hotter, but the window gets smaller because the greenhouse effect is trapping a lot of that radiation and preventing it from escaping. This greenhouse effect explains why the heat that does escape into space is directly related to the surface temperature, as the increase in heat emitted by the atmosphere is canceled out by the increased absorption from water vapor." Scientists discovered this linear relationship separates when Earth’s global normal surface temperatures go much past 300 K, or 80 F. In such a situation, it would be significantly more troublesome for the Earth to shed heat at a generally indistinguishable rate from its surface heat. For the present, that number is floating around 285 K, or 53 F.

To give an idea of what such a nonlinear world might look like, he invokes Venus — a planet that many scientists believe started out as a world similar to Earth, though much closer to the sun.Koll said, Sometime in the past, we think its atmosphere had a lot of water vapor, and the greenhouse effect would’ve become so strong that this window region closed off, and nothing could get out anymore, and then you get runaway heating. In which case the whole planet gets so hot that oceans start to boil off, nasty things start to happen, and you transform from an Earth-like world to what Venus is today. Estimating such runaway effect for earth, scientists found that it would not affect earth until the global average temperatures reach about 340 K, or 152 F. Global warming alone is insufficient to cause such warming, but other climatic changes, such as Earth’s warming over billions of years due to the sun’s natural evolution, could push Earth towards this limit.

"The team’s results may help to improve climate model predictions. They also may be useful in understanding how ancient hot climates on Earth unfolded," said Koll. If you were living on Earth 60 million years ago, it was a much hotter, wacky world, with no ice at the pole caps, and palm trees and crocodiles in what’s now Wyoming. One of the things we show is, once you push to really hot climates like that, which we know happened in the past, things get much more complicated.” The study is published in the Proceedings of the National Academy of Sciences. Research team involves EAPS postdoc Daniel Koll and Tim Cronin, the Kerr-McGee Career Development Assistant Professor in EAPS.

https://www.scien-technews.com/2018/09/how-earth-sheds-heat-into-space.html
 
"Localised event" doesn't do it justice; temperatures outside the equatorial zone rose abruptly in both hemispheres, even if more recent IPCC charts have de-fanged both the MWP and the Little Ice Age.

main-qimg-6a72a5e43e4f16fe2271e939f6bff44c


I'm not seeing the temperature fall two degrees from the height of the MWP in the large graphic; more like half a degree. Nor the sharp rise in the early 18th century as mentioned previously.

I am not sure what you're trying to say with that graph above. If you look at the scales of it, it aligns pretty closely with the graphic I posted. Of course, the one you're posting is relying upon data from 1990. We have developed many more sophisticated indirect measurements AND statistical techniques since then, let alone data science and its ability to extrapolate and interpolate.

Recent research suggests the Permian-Triassic extinction (assuming that's what you're referring to) occurred after a drop in sea level, which points to large-scale glaciation/cooling.

Permian-Extinction-Coincided-With-300-ppm-CO2-Isozaki-Servais-2018.jpg


Cooling-and-Low-Sea-Levels-Caused-Permian-Mass-Extinction-Kani-2018.jpg

From Wiki:

Suggested mechanisms for the latter include one or more large meteor impact events, massive volcanism such as that of the Siberian Traps, and the ensuing coal or gas fires and explosions,[16] and a runaway greenhouse effect triggered by sudden release of methane from the sea floor due to methane clathrate dissociation according to the clathrate gun hypothesis or methane-producing microbes known as methanogens.[17] Possible contributing gradual changes include sea-level change, increasing anoxia, increasing aridity, and a shift in ocean circulation driven by climate change.
 
How Earth sheds heat into space

Vishal Tiwari Tuesday, September 25, 2018

MIT scientists have discovered the appropriate response, alongside a forecast for when this linear relationship will break down. They saw that Earth emanates heat to space from the planet’s surface and additionally from the atmosphere.

The Earth sheds more heat into space as its surface heat up. In 1950, scientists observed a straightforward clear, linear connection between the Earth’s surface temperature and its active heat. As the earth is extremely messy system, with many complicated, interacting parts that can affect this process, it is difficult for scientists to explain why this relationship between surface temperature and outgoing heat is so simple and linear. Now, MIT scientists have discovered the appropriate response, alongside a forecast for when this linear relationship will break down. They saw that Earth emanates heat to space from the planet’s surface and additionally from the atmosphere. As both heat up, say by the expansion of carbon dioxide, the air holds more water vapor, which thusly acts to trap more heat in the air.

This strengthening of Earth’s greenhouse effect is known as water vapor feedback. Crucially, the team found that the water vapor feedback is just sufficient to cancel out the rate at which the hot atmosphere emits more heat into space. The general change in Earth’s produced heat therefore just relies upon the surface. Thus, the discharge of heat from Earth’s surface to space is a simple function of temperature, prompting to the observed linear relationship. The study in other words may also help to explain how extreme, hothouse climates in Earth’s ancient past unfolded.

During the study, scientists constructed a radiation code — basically, a model of the Earth and how it transmits heat, or infrared radiation, into space. The code reproduces the Earth as a vertical column, beginning from the ground, through the environment, lastly into space. Scientists can input a surface temperature into the section, and the code figures the measure of radiation that breaks through the whole column and into space. The team can then turn the temperature knob up and down to see how different surface temperatures would affect the outgoing heat. When they plotted their data, they observed a straight line — a linear relationship between surface temperature and outgoing heat, in line with many previous works, and over a range of 60 kelvins, or 108 degrees Fahrenheit. Daniel Koll, MIT’s Department of Earth, Atmospheric and Planetary Sciences (EAPS) said, So the radiation code gave us what Earth actually does, Then I started digging into this code, which is a lump of physics smashed together, to see which of these physics is actually responsible for this relationship."

For this, scientists programmed into their code various effects in the atmosphere, such as convection, and humidity, or water vapor, and turned these knobs up and down to see how they in turn would affect the Earth’s outgoing infrared radiation.We needed to break up the whole spectrum of infrared radiation into about 350,000 spectral intervals because not all infrared is equal," said Koll. "While water vapor does absorb heat or infrared radiation, it doesn’t absorb it indiscriminately, but at wavelengths that are incredibly specific, so much so that the team had to split the infrared spectrum into 350,000 wavelengths just to see exactly which wavelengths were absorbed by water vapor.”

Scientists observed that as the Earth’s surface temperature gets hotter, it basically needs to shed more heat into space. And yet, water vapor develops and acts to ingest and trap heat at specific wavelengths, making a greenhouse impact that keeps a small amount of heat from getting away. Koll said, It’s like there’s a window, through which a river of radiation can flow to space. The river flows faster and faster as you make things hotter, but the window gets smaller because the greenhouse effect is trapping a lot of that radiation and preventing it from escaping. This greenhouse effect explains why the heat that does escape into space is directly related to the surface temperature, as the increase in heat emitted by the atmosphere is canceled out by the increased absorption from water vapor." Scientists discovered this linear relationship separates when Earth’s global normal surface temperatures go much past 300 K, or 80 F. In such a situation, it would be significantly more troublesome for the Earth to shed heat at a generally indistinguishable rate from its surface heat. For the present, that number is floating around 285 K, or 53 F.

To give an idea of what such a nonlinear world might look like, he invokes Venus — a planet that many scientists believe started out as a world similar to Earth, though much closer to the sun.Koll said, Sometime in the past, we think its atmosphere had a lot of water vapor, and the greenhouse effect would’ve become so strong that this window region closed off, and nothing could get out anymore, and then you get runaway heating. In which case the whole planet gets so hot that oceans start to boil off, nasty things start to happen, and you transform from an Earth-like world to what Venus is today. Estimating such runaway effect for earth, scientists found that it would not affect earth until the global average temperatures reach about 340 K, or 152 F. Global warming alone is insufficient to cause such warming, but other climatic changes, such as Earth’s warming over billions of years due to the sun’s natural evolution, could push Earth towards this limit.

"The team’s results may help to improve climate model predictions. They also may be useful in understanding how ancient hot climates on Earth unfolded," said Koll. If you were living on Earth 60 million years ago, it was a much hotter, wacky world, with no ice at the pole caps, and palm trees and crocodiles in what’s now Wyoming. One of the things we show is, once you push to really hot climates like that, which we know happened in the past, things get much more complicated.” The study is published in the Proceedings of the National Academy of Sciences. Research team involves EAPS postdoc Daniel Koll and Tim Cronin, the Kerr-McGee Career Development Assistant Professor in EAPS.

https://www.scien-technews.com/2018/09/how-earth-sheds-heat-into-space.html

That runaway greenhouse effect is a long way off what we're capable of causing though. However, we know this will not be a linear response to Co2 emissions. I did a bit of work on chaotic systems and how it unpredictable they are, from what seems to be simple inputs, especially when the systems interacts on itself. Certain inputs/forcings on a system that seems to be stable will have a linear response then return to a very similar state. However, if the forcing is stronger or sustained for longer we can move away from what is called a Lorenz attractor. This leads to a period of instability as the system finds another Lorenz attractor.

If you like chemistry, physics or game theory you may call this "heterogeneous or multiple equilibria".

What needs to be taken into account with our current predicament is that Co2 will hang around and cause warming for 150 years. So we haven't seen the effect of over half of the Co2 we've put in the atmosphere yet. This is of course leading to methane releases from under northern hemisphere permafrost.

We have no idea how far this goes. The increase in the albedo effect from the reduction/loss of ice up north. The increase in ocean temperature causing the ocean to release Co2, rather than absorb it. Yes, as you say, the increase in water vapour as well.

We do not know what effect we're going to have on the marine boisphere either. The increase in Co2 in the ocean is currently leading to an increase in acidity, which is attacking the plankton. Damaging the bottom of the food chain is going to cause a tsunami of changes. This is while we continue to overfarm the top of the marine food chain.

We don't know where this all ends.

What I find most frustrating is that despite property prices and the increase in stock prices our world economy is very sluggish (the rise in xenophobia is a sign of that). Retooling the world economy to become carbon-free would revitalise our economy. Removing all emissions would change our air quality. Moving from combustion to electric engines would reduce the noise pollution of our cities. Vastly increasing the density of cities and the amount of public transport would see less land mass used and more efficient societies.

All of the changes required to deal with climate change will bring so many extra benefits to our society. Except for the fossil fuel lobby who's current mouthpieces are often the same mouthpieces the tobacco lobby used.
 
Last edited:
Our species has proven to be extremely adaptable. We can survive on a wide range of diets and in nearly all climates. I do not see how species dying out because of this. However, we have moved away from the adaptability and gone towards an agriculture-based technological society. This has been so successful that our population has grown to the point that we have to farm industrially to support ourselves.

Industrial farming relies upon a lot. I can see that falling over. We rely upon a predictable climate to build large farming and transport infrastructure. We need to power and house society too. This can only operate with civility underpinning it. We always hear about business needing stability above all. This is because all large projects and ventures require a big investment that will take a while to pay off. The most important part of stability is civility. The ability to trust one another. Once things get s**t enough then ripping off is going to become more common.

I don't think people realise how easy it will be for what we perceive as our all-powerful society to fall over. It has happened many times before. Afghanistan and East Africa and the war-lord societies have many parallels to post-Roman Western Europe.

If it all broke down and we were on our own, so to speak. How many of you would survive?
 
I am not sure what you're trying to say with that graph above. If you look at the scales of it, it aligns pretty closely with the graphic I posted.

We'll agree to disagree. The MWP is not discernible on the large graphic. In fact it is depicted as a period of slight cooling.
Of course, the one you're posting is relying upon data from 1990. We have developed many more sophisticated indirect measurements AND statistical techniques since then, let alone data science and its ability to extrapolate and interpolate.

I'll say! The resolve to disregard and tamper with historical records has come on in leaps and bounds. The post-1940 cooling period is an especially significant example. Ironing out that anomaly and lowering prior temperatures brought the trend into line with some climate models, whereas previously, none could reproduce the 1940-1960's temperature fall.
Suggested mechanisms for the latter include one or more large meteor impact events, massive volcanism such as that of the Siberian Traps, and the ensuing coal or gas fires and explosions,[16] and a runaway greenhouse effect triggered by sudden release of methane from the sea floor due to methane clathrate dissociation according to the clathrate gun hypothesis or methane-producing microbes known as methanogens.[17] Possible contributing gradual changes include sea-level change, increasing anoxia, increasing aridity, and a shift in ocean circulation driven by climate change.

Mmmm, I've just posted graphics from some recent papers which challenge that popular view. You wouldn't bet your house on either theory.
 
We'll agree to disagree. The MWP is not discernible on the large graphic. In fact it is depicted as a period of slight cooling.


I'll say! The resolve to disregard and tamper with historical records has come on in leaps and bounds. The post-1940 cooling period is an especially significant example. Ironing out that anomaly and lowering prior temperatures brought the trend into line with some climate models, whereas previously, none could reproduce the 1940-1960's temperature fall.


Mmmm, I've just posted graphics from some recent papers which challenge that popular view. You wouldn't bet your house on either theory.

There is evidence of the Siberian Traps. The meteor has been discredited. The Siberian traps caused 5-degree warming over 5k years. This caused the ocean to burp methane and drive another 5 degrees warming. We are highly likely to cause 5 degrees of warming in 2 centuries. Good luck.

Our rate of extinction is faster than that time anyhow.

Regards "tampering" with data. That means we have better methods for indirect methods.
 
Status
Not open for further replies.
Back
Top