catempire
Premium Platinum
As the title suggests
Follow along with the video below to see how to install our site as a web app on your home screen.
Note: This feature may not be available in some browsers.
Thanks for posting these - and this is probably a stupid question, what do the red & green mean?
I know at the basics it would be green = good, red = not so good, but not always the lowest gets red.
Thanks
Looking at one from last year, green = '30% above season average', and red = '30% below season average'.Thanks for posting these - and this is probably a stupid question, what do the red & green mean?
I know at the basics it would be green = good, red = not so good, but not always the lowest gets red.
Thanks
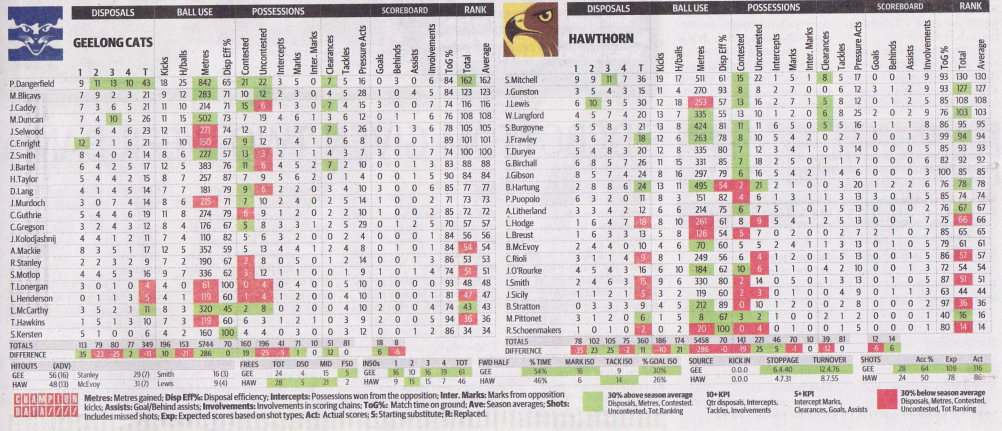
They have. Pressure points are:Unless they have re-defined what a pressure act is those numbers are huge
Edit: on a closer look those are pressure points... what ever those are

They can't be much f--king chop if Murdoch got 44 of them.Unless they have re-defined what a pressure act is those numbers are huge
Edit: on a closer look those are pressure points... what ever those are
They have. Pressure points are:
“Weighted sum of pressure acts. Under the Champion Data pressure point scoring system physical pressure acts are worth 3.75 points, closing pressure acts are worth 2.25 points, chasing pressure acts are worth 1.50 points, and corralling pressure acts which are worth 1.20 points.”
what... you dont have scissors, a phone with a camera and posting ability?
Nah. Still not trusted with scissors.what... you dont have scissors, a phone with a camera and posting ability?
GO Catters
what.. I can't wind up the wind up?Nah. Still not trusted with scissors.
You take me far too serious sometimes.
 Yesterday.