Which teams have had the hardest run up until the bye rounds?

Remove this Banner Ad

Ari

Brownlow Medallist
Sep 5, 2003
12,931
1,716
Pascoe Vale
AFL Club
Essendon
Other Teams
Ferrari
It's a simple question. The results are interesting, and mathematically true. I very rarely create threads, however thought I would share on this occasion as I feel this may impact the second half of the year.

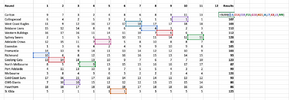
I've been keeping a spreadsheet of the difficulty of opponent each team faces, each week, to take an understanding of which teams are having an easier run than others. If you were playing Collingwood in Round 11 your team would be awarded 1 point, and if you were playing the Eagles in round 11 your team would be awarded 18 points. This will likely be different each round, as teams move about the ladder.

For example, Geelong were 18th on the ladder in Round 3 and playing bad footy. As such, the Gold Coast Suns received 18 points for playing a poor Geelong at that point in time. Fast forward to Round 8 and Geelong are 6th on the ladder so Adelaide received only 6 points for taking on a more formidable opponent. Geelong lost their Round 3 game to the Gold Coast and won their Round 8 game against Adelaide so the points awarded for difficulty of opponent at that time were true.

Keep in mind, this is all about the position of the team you play on the ladder at that point in time, wins and losses are irrelevant to this.

1686107827399.png

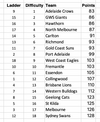
The above table lays out where each team was on the ladder for each round. The below is a total of each teams opponents ladder positions/points added up.

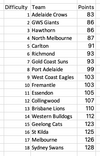
This demonstrates that Adelaide has had the hardest run up until Round 11.

1686107948622.png

So what does this mean? Well, it means that finals positions may see a bit of movement yet.... in my opinion.

When we look at the bottom 5 here, being the teams which have had the easiest run, we surely think that there may be a tougher run home for them, right?

Sydney, Melbourne, Saints, Geelong, Bulldogs.

Would love to know your thoughts after reading the above, or am I off with the fairies? :)
 
Geelong certainly weren't the worst side in the comp when the Suns played them. How would a ladder look based on team's current positions?
 

Log in to remove this ad.

Sorry, I meant if the scoring was done based on team's current positions.
ahhhhh ok, sure.

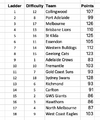
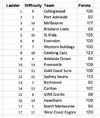
I've just assumed current position for each team for each round below. Pretty basic.

1686110224294.png

Sort by current ladder position for each team.

1686110524439.png

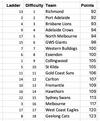
Sort by difficulty of proposed method (static for each round based on Round 11)

1686110555238.png
 
Your initial attempt was flawed, you can tell by the fact that each teams ladder position fluctuates wildly over the first few rounds whereas in the latter rounds you see ladder positions are more stable week to week (and continue to stabilise further over the course of the season).

For that reason you can pretty much write off your initial calculations. The results are based off incorrect assumptions / inputs.
 
It's a simple question. The results are interesting, and mathematically true. I very rarely create threads, however thought I would share on this occasion as I feel this may impact the second half of the year.

I've been keeping a spreadsheet of the difficulty of opponent each team faces, each week, to take an understanding of which teams are having an easier run than others. If you were playing Collingwood in Round 11 your team would be awarded 1 point, and if you were playing the Eagles in round 11 your team would be awarded 18 points. This will likely be different each round, as teams move about the ladder.

For example, Geelong were 18th on the ladder in Round 3 and playing bad footy. As such, the Gold Coast Suns received 18 points for playing a poor Geelong at that point in time. Fast forward to Round 8 and Geelong are 6th on the ladder so Adelaide received only 6 points for taking on a more formidable opponent. Geelong lost their Round 3 game to the Gold Coast and won their Round 8 game against Adelaide so the points awarded for difficulty of opponent at that time were true.

Keep in mind, this is all about the position of the team you play on the ladder at that point in time, wins and losses are irrelevant to this.
View attachment 1706638

The above table lays out where each team was on the ladder for each round. The below is a total of each teams opponents ladder positions/points added up.

This demonstrates that Adelaide has had the hardest run up until Round 11.
View attachment 1706639

So what does this mean? Well, it means that finals positions may see a bit of movement yet.... in my opinion.

When we look at the bottom 5 here, being the teams which have had the easiest run, we surely think that there may be a tougher run home for them, right?

Sydney, Melbourne, Saints, Geelong, Bulldogs.

Would love to know your thoughts after reading the above, or am I off with the fairies? :)
Ari,

Travel issues aside I like the start of this approach but suggest that:

- you use the static laser position as at the end of Round 11 (eliminate impact of bye)

- you re-run the analysis again using the outcomes of your first analysis to determine how difficult an opposition team was.

- the difficulty for a team be ladder position -1 as a team cannot play themselves.

Regards

S. Pete
 
I like the theory but it doesn't really check out as the early part of the season throws everything off.

Also yeah, travel is a factor. St Kilda played in Victoria in all bar one of their opening 8 games, 6 of which were at Marvel (the other 1 was a home game at the MCG), as opposed to us for example who played 3 at Marvel, 3 interstate and 2 at the MCG. Conditions would also be a factor in that too. From memory we played in 3 heavy track games in the opening 8 rounds.
 

(Log in to remove this ad.)

Hey some great comments guys, particularly in the home/away space.... which has an impact on difficulty.

In addition, a couple people have said the earlier rounds throw it out a little. This is true. I presented a second version above in the comments to base positions all on Round 11 ladder position.

I'll continue to update the method and math here as I think it can tell us a bit.
 
I lie the theory but it doesn't really check out as the early part of the season throws everything off.

Also yeah, travel is a factor. St Kilda played in Victoria in all bar one of their opening 8 games, 6 of which were at Marvel (the other 1 was a home game at the MCG), as opposed to us for example who played 3 at Marvel, 3 interstate and 2 at the MCG. Conditions would also be a factor in that too. From memory we played in 3 heavy track games in the opening 8 rounds.
Out of 11 rounds, Bulldogs have played one more game than Saints outside of Victoria. Out of 12 then we have the same amount of home v away games.
 
Huh?

So you don't reckon Port are a stronger proposition at home than they are away from home?

Meaning Collingwood should be confident of beating Port by 12 goals regardless of where the match is played?

For Port, possibly marginally stronger at home, but it's close. We've been very good on the road this year.

Other teams you mentioned such as Adelaide, on the other hand, have had starkly different results H and A.

As to Collingwood I relish the chance for another shot at them.
 
Out of 11 rounds, Bulldogs have played one more game than Saints outside of Victoria. Out of 12 then we have the same amount of home v away games.
This is an absurdly simple way of viewing each teams fixtures lol.
 

Remove this Banner Ad

Back
Top