Navigation
Install the app
How to install the app on iOS
Follow along with the video below to see how to install our site as a web app on your home screen.
Note: This feature may not be available in some browsers.
More options


You are using an out of date browser. It may not display this or other websites correctly.
You should upgrade or use an alternative browser.
You should upgrade or use an alternative browser.
Analysis Season 2023 - Statistics and Analytics Thread
- Thread starter Tom14
- Start date
- Tagged users None

The Flying Belgian
Third Tall
Tom is that monk from the da Vinci Code that whips himself while watching David King

Statistics can be manipulated to suit a narrative...

- Mar 12, 2003
- 3,500
- 5,958
- AFL Club
- Brisbane Lions
- Other Teams
- Brisbane
This evening's result is not only marvellous for the elimination of the Bulldogs, but it also means we have beaten 4 top 8 teams on the road for the first time in our (merged) club's history.
Our previous best was in 1999 when we beat Carlton, Port Adelaide and Sydney, all away.
Our previous best was in 1999 when we beat Carlton, Port Adelaide and Sydney, all away.

Jivlain
Hammelmann Appreciation Society
- Sep 19, 2015
- 8,340
- 14,750
- AFL Club
- Brisbane Lions
- Other Teams
- Swansea City
- Moderator
- #256
As David King noted, it's 38 wins, 38 losses. So they are the 50-50 games we've been talking about
- Mar 12, 2003
- 3,500
- 5,958
- AFL Club
- Brisbane Lions
- Other Teams
- Brisbane
Top 8 v top 4 teams
Brisbane 3-2 (102.62)
Melbourne 2-2 (97.1)
Port 2-2 (95.9)
Collingwood 2-3 (102.65)
Carlton 2-3 (99.0)
Giants 1-3 (67.0)
St Kilda 0-5 (80.9)
Sydney 0-5 (73.8)
Brisbane 3-2 (102.62)
Melbourne 2-2 (97.1)
Port 2-2 (95.9)
Collingwood 2-3 (102.65)
Carlton 2-3 (99.0)
Giants 1-3 (67.0)
St Kilda 0-5 (80.9)
Sydney 0-5 (73.8)
- Oct 13, 2015
- 8,762
- 21,443
- AFL Club
- Brisbane Lions
- Thread starter
- #258
Rough differentials for expected score vs actual score for each team on the season - we had the second most scored against us above expectation behind port:
Last edited:
- Oct 13, 2015
- 8,762
- 21,443
- AFL Club
- Brisbane Lions
- Thread starter
- #259
Posted in the match thread about the Shinboner website's finals dossier for Brisbane. This will be posted publicly later today I think but here's a few interesting snippets from it and I'll edit in a link to the full thing later so you can read it for yourself:
 videopress.com
Not sure the above video comes across as easily as it does on the shinboner page - so worth looking at the original post when it goes public.
A snapshot of Brisbane’s home and away season

Brisbane’s strengths: How they beat you
It feels a little odd to use a game where Brisbane coughed up a 24-point lead with seven minutes to go as proof of how their ball movement improved, but what’s forgotten is up until that point, the Lions had sliced through Melbourne’s vaunted defence time and time again.
Over the first half of the season, their style of movement meant they would have been less likely to. Think back to Round 3 against the Western Bulldogs where they were content to take the percentage play time and time again, gifting the opposition exactly what they wanted.
Although Brisbane has always been a kick-heavy team – in the top two for kick to handball ratio in each of the last five years – as 2023 wore on they found the right balance in using it to attack, and it was on show against the Demons.
The key is how Brisbane looked for – and found – the soft spots in Melbourne’s defence. Here’s one elongated example…
04-brisbane-v-melbourne-1-mp4
videopress.com
Not sure the above video comes across as easily as it does on the shinboner page - so worth looking at the original post when it goes public.
Josh Dunkley’s arrival – along with Ashcroft until his season ending injury – simplified Brisbane’s midfield rotation considerably.PLAYERCARDSTART5Josh Dunkley
- Age
- 27
- Ht
- 191cm
- Wt
- 87kg
- Pos.
- Mid
CareerSeasonLast 5
- D
- 21.8
- 5star
- K
- 10.4
- 4star
- HB
- 11.3
- 5star
- M
- 4.3
- 4star
- T
- 5.8
- 5star
- CL
- 3.2
- 5star
- D
- 20.7
- 5star
- K
- 7.0
- 3star
- HB
- 13.7
- 5star
- M
- 2.3
- 2star
- T
- 5.3
- 5star
- CL
- 2.7
- 4star
- D
- 14.2
- 4star
- K
- 7.2
- 3star
- HB
- 7.0
- 5star
- M
- 4.8
- 5star
- T
- 4.0
- 5star
- CL
- 1.4
- 4star
PLAYERCARDEND
In 2022 it was Lachie Nealeas an ever present, followed by Jarryd LyonsPLAYERCARDSTART9Lachie Neale
- Age
- 30
- Ht
- 178cm
- Wt
- 84kg
- Pos.
- Mid
CareerSeasonLast 5
- D
- 27.0
- 5star
- K
- 11.5
- 4star
- HB
- 15.5
- 5star
- M
- 4.0
- 4star
- T
- 3.7
- 5star
- CL
- 5.9
- 5star
- D
- 28.3
- 5star
- K
- 13.9
- 5star
- HB
- 14.4
- 5star
- M
- 4.6
- 4star
- T
- 4.0
- 5star
- CL
- 5.9
- 5star
- D
- 12.0
- 3star
- K
- 4.6
- 2star
- HB
- 7.4
- 5star
- M
- 2.0
- 3star
- T
- 1.0
- 3star
- CL
- 0.4
- 3star
PLAYERCARDENDand Hugh McCluggagePLAYERCARDSTART17Jarryd Lyons
- Age
- 31
- Ht
- 184cm
- Wt
- 86kg
- Pos.
- Mid
CareerSeasonLast 5
- D
- 20.5
- 5star
- K
- 11.8
- 4star
- HB
- 8.7
- 5star
- M
- 2.9
- 3star
- T
- 4.4
- 5star
- CL
- 4.8
- 5star
- D
- 21.7
- 5star
- K
- 14.7
- 5star
- HB
- 7.0
- 4star
- M
- 3.4
- 3star
- T
- 5.1
- 5star
- CL
- 4.7
- 5star
- D
- 11.0
- 3star
- K
- 5.2
- 2star
- HB
- 5.8
- 4star
- M
- 1.8
- 2star
- T
- 2.0
- 4star
- CL
- 1.6
- 4star
PLAYERCARDENDas distant second and third bananas, then a rotating, changing cast elsewhere from week to week.PLAYERCARDSTART6Hugh Mccluggage
- Age
- 26
- Ht
- 185cm
- Wt
- 84kg
- Pos.
- Mid
CareerSeasonLast 5
- D
- 19.3
- 5star
- K
- 11.4
- 4star
- HB
- 7.9
- 5star
- M
- 4.0
- 4star
- T
- 3.0
- 5star
- CL
- 2.2
- 4star
- D
- 19.0
- 4star
- K
- 12.0
- 5star
- HB
- 7.0
- 4star
- M
- 3.6
- 4star
- T
- 2.9
- 4star
- CL
- 2.0
- 4star
- D
- 13.2
- 4star
- K
- 7.8
- 3star
- HB
- 5.4
- 4star
- M
- 4.2
- 4star
- T
- 1.8
- 4star
- CL
- 0.6
- 3star
PLAYERCARDEND
This year it’s been Neale and Dunkley as full-time, reliable on-ballers. Having Dunkley as the two-way player in tight has allowed the Lions to be the best side in the competition in clearance differential. Their +153 this year is a far cry from their 2022 numbers: +13 and 10th in the league.
Although the Lions don’t light games on fire with their scoring from stoppages – 11th for points per clearance win – it’s the sheer weight of numbers which overwhelms opponents.
11th for points per clearance win translates to fifth for total points from clearances and fuels their forward half game. If a team is constantly winning stoppages, simple logic reasons they’ll have the ball closer to goal more often than not.
Having those two midfield linchpins has allowed Brisbane to mix and match their partners depending on game situation and player availability.
The question: Are Brisbane a much better side than previous years?
No doubt there have been improvements in certain areas this year. Dunkley has been vital, Ashcroft important until his injury, and Jack Payne has blossomed into a reliable key defender, allowing Harris Andrewsto run his own race behind the ball.PLAYERCARDSTART31Harris Andrews
- Age
- 27
- Ht
- 202cm
- Wt
- 98kg
- Pos.
- Def
CareerSeasonLast 5
- D
- 12.8
- 3star
- K
- 7.4
- 3star
- HB
- 5.4
- 4star
- M
- 5.6
- 5star
- T
- 1.6
- 4star
- MG
- 151.7
- 2star
- D
- 17.0
- 4star
- K
- 9.0
- 4star
- HB
- 8.0
- 4star
- M
- 4.0
- 4star
- T
- 2.0
- 3star
- D
- 9.8
- 3star
- K
- 5.0
- 2star
- HB
- 4.8
- 4star
- M
- 3.4
- 4star
- T
- 1.6
- 4star
- MG
- 94.0
- 2star
PLAYERCARDEND
For all that, there are still plenty of lingering questions on how Brisbane’s team defence will hold up without a contest advantage in high pressure games, and whether they can maintain the execution needed for their ball movement to translate into scoreboard pressure.
They’re the ultimate ‘prove it in finals’ test case. But of their five finals campaigns under Chris Fagan, this looms as the year where they don’t necessarily have to be much better than previous years to reach a Grand Final. Those incremental improvements, two home finals, and the overall evenness of the competition could all fall in Brisbane’s favour.
- Oct 13, 2015
- 8,762
- 21,443
- AFL Club
- Brisbane Lions
- Thread starter
- #260
Link to the Shinboner finals dossier for us if anyone wants to read more: 2023 Finals Dossier: Brisbane Lions
I respect Squiggle and I think this suggests we (I) have massively underrated GWS this year. Are they a some kind of decent chance of making the GF? They are right up there in contention.


- Mar 12, 2003
- 3,500
- 5,958
- AFL Club
- Brisbane Lions
- Other Teams
- Brisbane
I think so. They're a heck of a team. A 6 day break leading into the Prelim against Collingwood will sort them out one way or the other... get through that and anything's possible.I respect Squiggle and I think this suggests we (I) have massively underrated GWS this year. Are they a some kind of decent chance of making the GF? They are right up there in contention.
View attachment 1799833
- Mar 12, 2003
- 3,500
- 5,958
- AFL Club
- Brisbane Lions
- Other Teams
- Brisbane
Updated quarter by quarter stats ahead of this weekend's matches. Be on the lookout for both Melbourne and the Giants to finish very strongly.


Section 5
Norm Smith Medallist
- Nov 26, 2018
- 6,001
- 9,157
- AFL Club
- Brisbane Lions
A shame we don't have one for the last month on the teams left in the race.Updated quarter by quarter stats ahead of this weekend's matches. Be on the lookout for both Melbourne and the Giants to finish very strongly.
View attachment 1803304
That would be a bit more relevant heading into the GF.
- Mar 12, 2003
- 3,500
- 5,958
- AFL Club
- Brisbane Lions
- Other Teams
- Brisbane
I see what you are trying to do here. And I'm all in.A shame we don't have one for the last month on the teams left in the race.
That would be a bit more relevant heading into the GF.
Last 5 weeks (4 home and away rounds + finals week 1):

- Oct 13, 2015
- 8,762
- 21,443
- AFL Club
- Brisbane Lions
- Thread starter
- #266
Belated post following on from the tuesday night Champion data segment on SEN - how contested ball is a big indicator for our record:
The key point is that we are 17-1 when we don't lose contested ball by double digits (i.e. -9 or better), but 1-5 when we lose contested ball by 10.
I like to nitpick champion data (and I had a quiet morning at work) so I actually went and looked at the other top 4 teams to see if we were a significant outlier on this stat. And in reality I think we are:
Pies
Dees
Port
Port have the closest profile to us with a 4-4 record when they lose contested ball by double digits, so maybe it is an indicator of having a defence less able to compensate for when you are losing contested ball?
The key point is that we are 17-1 when we don't lose contested ball by double digits (i.e. -9 or better), but 1-5 when we lose contested ball by 10.
I like to nitpick champion data (and I had a quiet morning at work) so I actually went and looked at the other top 4 teams to see if we were a significant outlier on this stat. And in reality I think we are:
Pies
| Contested ball differential | Record |
| -10 or worse | 3-2 |
| -9 or better | 16-3 |
Dees
| Contested ball differential | Record |
| -10 or worse | 2-1 |
| -9 or better | 15-6 |
Port
| Contested ball differential | Record |
| -10 or worse | 4-4 |
| -9 or better | 13-3 |
Port have the closest profile to us with a 4-4 record when they lose contested ball by double digits, so maybe it is an indicator of having a defence less able to compensate for when you are losing contested ball?
| Team | P | W | D | L |
| Western Bulldogs | 44 | 21 | 23 | |
| Port Adelaide | 42 | 21 | 2 | 19 |
| North Melbourne | 42 | 21 | 1 | 20 |
| Geelong | 41 | 17 | 24 | |
| Sydney | 40 | 15 | 1 | 24 |
| Collingwood | 38 | 23 | 15 | |
| St Kilda | 38 | 22 | 16 | |
| Carlton | 38 | 22 | 16 | |
| Adelaide | 38 | 20 | 18 | |
| Hawthorn | 38 | 17 | 21 | |
| Richmond | 38 | 12 | 1 | 25 |
| Melbourne | 37 | 19 | 18 | |
| West Coast | 37 | 15 | 22 | |
| Essendon | 36 | 18 | 1 | 17 |
| Fremantle | 34 | 18 | 16 | |
| Gold Coast | 25 | 18 | 7 | |
| Greater Western Sydney | 15 | 8 | 7 | |
| TOTAL | 621 | 307 | 6 | 308 |
Let's get back up to and over 50% by the end of the season, eh?
- Mar 12, 2003
- 3,500
- 5,958
- AFL Club
- Brisbane Lions
- Other Teams
- Brisbane
What's this? We aren't even listed there?
Team P W D L Western Bulldogs 44 21 23 Port Adelaide 42 21 2 19 North Melbourne 42 21 1 20 Geelong 41 17 24 Sydney 40 15 1 24 Collingwood 38 23 15 St Kilda 38 22 16 Carlton 38 22 16 Adelaide 38 20 18 Hawthorn 38 17 21 Richmond 38 12 1 25 Melbourne 37 19 18 West Coast 37 15 22 Essendon 36 18 1 17 Fremantle 34 18 16 Gold Coast 25 18 7 Greater Western Sydney 15 8 7 TOTAL 621 307 6 308
Let's get back up to and over 50% by the end of the season, eh?
Sorry, it's our results against each team since the mergerWhat's this? We aren't even listed there?
Section 5
Norm Smith Medallist
- Nov 26, 2018
- 6,001
- 9,157
- AFL Club
- Brisbane Lions
The 6 teams left in the finals.I see what you are trying to do here. And I'm all in.
Last 5 weeks (4 home and away rounds + finals week 1):
View attachment 1803394
Their last 5 games % per quarter and ACPQ rank
Taken from Grasshopper17 above chart.
Melbourne played: Nth, Blues, Hawks, Swans, Pies.
GWS played.......: Swans, Power, bombers, Blues, Saints.
Lions played......: Dockers, Crows, Pies, Saints, Power.
Carlton played...: Saints, demons, Suns, GWS, Swans.
Port played.......: Cats, GWS, Dockers, Tigers, Lions.
Pies played.......: Hawks, Cats, Lions, Bombers, Demons.
| Team | ACPQ Rank Year (Last 5 games) | % per Quarter 1 | Quarter 2 | Quarter 3 | Quarter 4 | ACPQ Last 5 Games |
| Melbourne | 2 (2) | 84.9 | 160.9 | 126.9 | 254.1 | 38.19% |
| GWS | 1 (3) | 102.9 | 117.9 | 147.5 | 140.5 | 13.19% |
| Brisbane lions | 16 (5) | 104.3 | 112.6 | 127.1 | 125.9 | 6.37% |
| Carlton | 13 (6) | 95.8 | 121.8 | 79.2 | 126.3 | 4.32% |
| Port | 10 (8) | 101.2 | 113.6 | 120.6 | 97.3 | -0.43% |
| Pies | 15 (17) | 102.7 | 144.3 | 126.4 | 62.1 | -11.05% |
- Mar 12, 2003
- 3,500
- 5,958
- AFL Club
- Brisbane Lions
- Other Teams
- Brisbane
Updated quarter by quarter stats.
Full season:

And the last 5 weeks (Preliminary Final teams only):

It's interesting to look at the remaining 4 teams. Our opponent, Carlton, did win their last quarter against Melbourne but they conceded 8 scores to 6 and to be honest looked out on their feet. The game before that they lost the last quarter (and the 3rd quarter) to Sydney, a team who has really struggled to run out games this year, as evidenced by the chart above. And it was comprehensive: 4 scores to 8 in the third and 3 scores to 7 in the last. Before that, they got blown off the park by the Giants in the last quarter and a half.
In the other game, Collingwood are highly regarded for their ability to run out games and win the close ones. But in their Qualifying Final, they really were obliterated in the last quarter, and were lucky to only concede 5 scores while having 2 of their own. The game before that, admittedly a nothing 2nd half against Essendon, they still conceded 10 scores to 7 after half time. Our last quarter was impressive against them, even Dad's army Geelong kicked 5 goals to 3 against them in the last. You have to go back to Round 19 against Port to find the last time they comprehensively outscored any team in the last quarter.
Even their opponents, the Giants, despite being at the top of both tables above, in their two finals they have "done enough" rather than putting the foot on the throat. 10 scores against to 2 in the last quarter against Port, after conceding 5 to 4 against St Kilda.
On the flipside, in our recent last quarters we've had 7 shots to 2 against Port, 9 to 3 against St Kilda, 8 to 6 against Collingwood. It's actually a pretty good recent record, certainly compared to the 3 remaining teams, and that's certainly something I didn't think I'd be writing a month ago. Indeed, our last quarters have been our best in the last 5 weeks
Something I observed in our last couple of games was the number of goals we kicked in red time. I saw this as previously a weakness of ours. That was always the strength of the 3peat teams. You always knew they would never give up.Updated quarter by quarter stats.
Full season:
View attachment 1809047
And the last 5 weeks (Preliminary Final teams only):
View attachment 1809048
It's interesting to look at the remaining 4 teams. Our opponent, Carlton, did win their last quarter against Melbourne but they conceded 8 scores to 6 and to be honest looked out on their feet. The game before that they lost the last quarter (and the 3rd quarter) to Sydney, a team who has really struggled to run out games this year, as evidenced by the chart above. And it was comprehensive: 4 scores to 8 in the third and 3 scores to 7 in the last. Before that, they got blown off the park by the Giants in the last quarter and a half.
In the other game, Collingwood are highly regarded for their ability to run out games and win the close ones. But in their Qualifying Final, they really were obliterated in the last quarter, and were lucky to only concede 5 scores while having 2 of their own. The game before that, admittedly a nothing 2nd half against Essendon, they still conceded 10 scores to 7 after half time. Our last quarter was impressive against them, even Dad's army Geelong kicked 5 goals to 3 against them in the last. You have to go back to Round 19 against Port to find the last time they comprehensively outscored any team in the last quarter.
Even their opponents, the Giants, despite being at the top of both tables above, in their two finals they have "done enough" rather than putting the foot on the throat. 10 scores against to 2 in the last quarter against Port, after conceding 5 to 4 against St Kilda.
On the flipside, in our recent last quarters we've had 7 shots to 2 against Port, 9 to 3 against St Kilda, 8 to 6 against Collingwood. It's actually a pretty good recent record, certainly compared to the 3 remaining teams, and that's certainly something I didn't think I'd be writing a month ago. Indeed, our last quarters have been our best in the last 5 weeks
- Mar 12, 2003
- 3,500
- 5,958
- AFL Club
- Brisbane Lions
- Other Teams
- Brisbane
Yeah this too is interesting.Something I observed in our last couple of games was the number of goals we kicked in red time. I saw this as previously a weakness of ours. That was always the strength of the 3peat teams. You always knew they would never give up.
Red time records in Finals:
Collingwood 2-1 (13) v Melbourne 0
Collingwood 0 v Melbourne 0-2 (2)
Collingwood 1-1 (7) v Melbourne 1-3 (9)
Collingwood 0 v Melbourne 1-0 (6)
--------------------------------------------------
Collingwood 3-2 (20) v Melbourne 2-5 (17)
Carlton 1-1 (7) v Sydney 0-2 (2)
Carlton 2-0 (12) v Sydney 1-1 (7)
Carlton 1-0 (6) v Sydney 2-1 (13)
Carlton 1-0 (6) v Sydney 1-2 (8)
--------------------------------------------------
Carlton 5-1 (31) v Sydney 4-6 (30)
St Kilda 0-2 (2) v GWS 3-2 (20)
St Kilda 4-1 (25) v GWS 2-0 (12)
St Kilda 3-0 (18) v GWS 2-0 (12)
St Kilda 1-1 (7) v GWS 0
--------------------------------------------------
St Kilda 8-4 (52) v GWS 7-2 (44)
Brisbane 1-1 (7) v Port 1-1 (7)
Brisbane 3-1 (19) v Port 2-0 (12)
Brisbane 4-0 (24) v Port 1-2 (8)
Brisbane 1-2 (8) v Port 2-0 (12)
--------------------------------------------------
Brisbane 9-4 (58) v Port 6-3 (39)
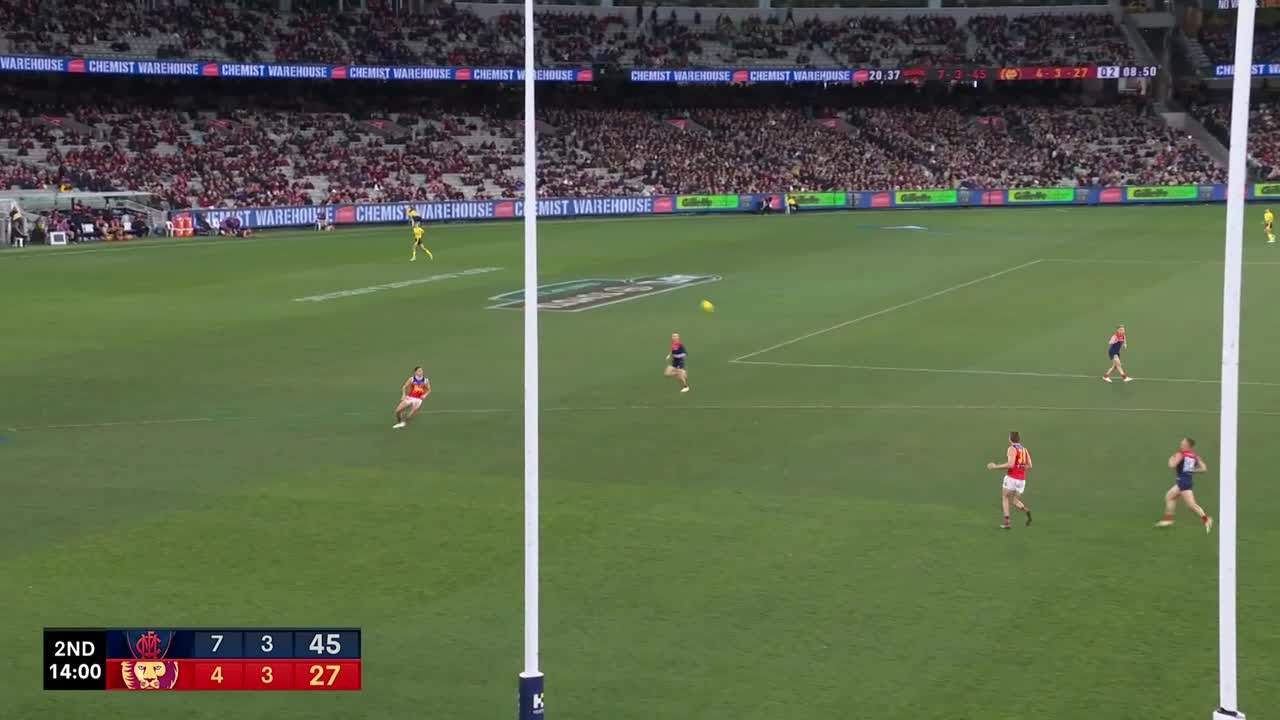
Melbourne 0 v Carlton 2-0 (12)
Melbourne 0-3 (3) v Carlton 0-1 (1)
Melbourne 1-2 (8) v Carlton 0-1 (1)
Melbourne 0-2 (2) v Carlton 2-1 (13)
--------------------------------------------------
Melbourne 1-7 (13) v Carlton 4-3 (27)
Port 2-0 (12) v GWS 2-3 (15)
Port 0-4 (4) v GWS 0-4 (4)
Port 0 v GWS 0-3 (3)
Port 0-4 (4) v GWS 1-0 (6)
--------------------------------------------------
Port 2-8 (20) v GWS 3-10 (28)
So overall it's
| Team | For | Against | % | Scores for | Scores against | Scores % | Weighted % |
| Brisbane | 9-4 (58) | 6-3 (39) | 148.7 | 13 | 9 | 144.4 | 146.6 |
| Sydney | 4-6 (30) | 5-1 (31) | 96.8 | 10 | 6 | 166.7 | 131.8 |
| St Kilda | 8-4 (52) | 7-2 (44) | 118.2 | 12 | 9 | 133.3 | 125.8 |
| Carlton | 9-4 (58) | 5-13 (43) | 134.9 | 13 | 18 | 72.2 | 103.4 |
| GWS | 10-12 (72) | 10-12 (72) | 100.0 | 22 | 22 | 100.0 | 100.0 |
| Collingwood | 3-2 (20) | 2-5 (17) | 117.7 | 5 | 7 | 71.4 | 94.6 |
| Melbourne | 3-12 (30) | 7-5 (47) | 63.8 | 15 | 12 | 125.0 | 94.4 |
| Port | 8-11 (59) | 12-14 (86) | 68.6 | 19 | 26 | 73.1 | 70.8 |
Interestingly though, we scored 9 goals to 6 in red time against Port, which means we scored 10 goals to 5 for the rest of the game. I think as a general trend, the only concrete observation is that scoring is heavier in red time, at both ends.
Nunez
Premium Platinum
Updated quarter by quarter stats.
Full season:
View attachment 1809047
And the last 5 weeks (Preliminary Final teams only):
View attachment 1809048
It's interesting to look at the remaining 4 teams. Our opponent, Carlton, did win their last quarter against Melbourne but they conceded 8 scores to 6 and to be honest looked out on their feet. The game before that they lost the last quarter (and the 3rd quarter) to Sydney, a team who has really struggled to run out games this year, as evidenced by the chart above. And it was comprehensive: 4 scores to 8 in the third and 3 scores to 7 in the last. Before that, they got blown off the park by the Giants in the last quarter and a half.
In the other game, Collingwood are highly regarded for their ability to run out games and win the close ones. But in their Qualifying Final, they really were obliterated in the last quarter, and were lucky to only concede 5 scores while having 2 of their own. The game before that, admittedly a nothing 2nd half against Essendon, they still conceded 10 scores to 7 after half time. Our last quarter was impressive against them, even Dad's army Geelong kicked 5 goals to 3 against them in the last. You have to go back to Round 19 against Port to find the last time they comprehensively outscored any team in the last quarter.
Even their opponents, the Giants, despite being at the top of both tables above, in their two finals they have "done enough" rather than putting the foot on the throat. 10 scores against to 2 in the last quarter against Port, after conceding 5 to 4 against St Kilda.
On the flipside, in our recent last quarters we've had 7 shots to 2 against Port, 9 to 3 against St Kilda, 8 to 6 against Collingwood. It's actually a pretty good recent record, certainly compared to the 3 remaining teams, and that's certainly something I didn't think I'd be writing a month ago. Indeed, our last quarters have been our best in the last 5 weeks
Timing our run baby!
Similar threads
- Replies
- 47
- Views
- 2K
- Replies
- 126
- Views
- 12K
- Replies
- 557
- Views
- 46K
- Replies
- 18
- Views
- 3K
- Replies
- 1
- Views
- 1K
