Remove this Banner Ad

Mega Thread The Stats Thread

🥰 Love BigFooty? Join now for free.

jgBLkpY.png

6rK9YzX.png

xDr7iSj.png
 
Richmond's poor start to the season has been analysed by the various arms of the Victorian-centric AFL media, with a lot of the finger pointing going towards the coach, injuries to key players, their recent recruitment policy of taking in mature age recruits(or 'list clogging' in BF speak) etc.

Taking an objective view via the stats show that the Tigers fall from their Top 8 finish last year really boils down to a lack of numbers in the important areas.

In 2015, the Tigers were the best team (and by some margin) at limiting the number of times the opposition could get their hands on the ball. The theory being the more game time the ball spends in our own hands, the less potential for damage by the opposition. This led to a low number of inside 50 entries conceded, which was then backed by a miserly defence which were 2nd in the league in goals conceded per inside 50 entry (behind the Swans of course). This year the numbers for all 3 categories have blown out.

Unfortunately for the Tigers this game plan looks outdated and has been superseded by a new wave of fast moving, high scoring football that has left teams like Fremantle and the Tigers in their wake with their antediluvian possession style football.

Let's compare the 2015 and 2016 stats.

2015
Team | Disposals Conceded | Rank
\ Richmond | 339.3 | 1st
\N. Melbourne|349.3|2nd
\Fremantle|350.6|3rd
\Melbourne|352.5|4th
\P. Adelaide|355.0|5th
\W. Coast|355.1|6th
\Hawthorn|360.4|7th
\Brisbane|360.5|8th
\ Sydney | 362.4 | 9th
\Essendon|363.8|10th
\GWS|365.5|11th
\Carlton|366.9|12th
\Adelaide|367.6|13th
\Geelong|368.5|14th
\W. Bulldogs|369.7|15th
\St Kilda|375.2|16th
\Collingwood|383.4|17th
\Gold Coast|404.2|18th

2016
Team | Disposals Conceded | Rank
\W. Bulldogs|341.1|1st
\GWS|347.9|2nd
\Geelong|354.7|3rd
\N. Melbourne|360.3|4th
\ Sydney | 363.0 | 5th
\ Richmond | 368.3 | 6th
\Melbourne|370.1|7th
\Hawthorn|370.8|8th
\W. Coast|372.1|9th
\Adelaide|374.0|10th
\Carlton|378.9|11th
\P. Adelaide|382.4|12th
\Gold Coast|383.3|13th
\St Kilda|386.0|14th
\Essendon|390.9|15th
\Fremantle|393.9|16th
\Brisbane|394.1|17th
\Collingwood|403.1|18th


2015
Team | I50 Conceded | Rank
\Fremantle|42.9|1st
\W. Coast|43.2|2nd
\Hawthorn|43.8|3rd
\ Richmond | 46.7 | 4th
\ Sydney | 48.4 | 5th
\Collingwood|49.1|6th
\W. Bulldogs|49.6|7th
\Geelong|50.3|8th
\Adelaide|50.9|9th
\P. Adelaide|51.5|10th
\GWS|51.6|11th
\N. Melbourne|51.9|12th
\St Kilda|52.6|13th
\Melbourne|53.4|14th
\Brisbane|54.0|15th
\Essendon|55.1|16th
\Carlton|55.6|17th
\Gold Coast|57.7|18th


2016
Team | I50 Conceded | Rank
\W. Bulldogs|39.4|1st
\Geelong|42.6|2nd
\W. Coast|47.6|3rd
\Hawthorn|48.6|4th
\Melbourne|51.1|5th
\ Sydney | 51.9 | 6th
\GWS|52.0|7th
\Carlton,Fremantle|52.4|eq. 8th
\N. Melbourne|53.1|10th
\P. Adelaide|55.9|11th
\St Kilda|56.9|12th
\ Richmond | 57.0 | 13th
\Essendon|57.7|14th
\Collingwood|58.0|15th
\Gold Coast|59.1|16th
\Adelaide|59.4|17th
\Brisbane|60.4|18th

2016
Team | I50 differential | Rank
\W. Bulldogs|+19.3|1st
\Geelong|+15.7|2nd
\ Sydney | +13.3 | 3rd
\W. Coast|+7.3|4th
\Melbourne|+6.4|5th
\Hawthorn|+5.3|6th
\GWS|+4.0|7th
\P. Adelaide|+2.1|8th
\N. Melbourne|+0.7|9th
\Carlton|-0.9|10th
\St Kilda|-5.7|11th
\Fremantle|-6.4|12th
\Adelaide|-7.0|13th
\ Richmond | -10.0 | 14th
\Collingwood|-10.1|15th
\Gold Coast|-10.3|16th
\Essendon|-11.7|17th
\Brisbane|-12.0|18th

2015
Team | Opp. goal per I50 | Rank
\ Sydney | 21.0% | 1st
\ Richmond | 21.4% | 2nd
\Hawthorn|22.9%|3rd
\Fremantle|23.9%|4th
\GWS|24.0%|5th
\W. Coast|24.1%|6th
\P. Adelaide|24.3%|7th
\N. Melbourne|24.5%|8th
\W. Bulldogs|24.6%|9th
\Adelaide|24.9%|10th
\Collingwood|25.0%|11th
\Geelong|25.2%|12th
\Melbourne|25.6%|13th
\Gold Coast|25.7%|14th
\Essendon|25.7%|15th
\St Kilda|27.6%|16th
\Carlton|28.5%|17th
\Brisbane|28.7%|18th


2016
Team | Opp. goal per I50 | Rank
\ Sydney | 19.6% | 1st
\Geelong|21.8%|2nd
\GWS|21.8%|3rd
\N. Melbourne|23.4%|4th
\Adelaide|23.6%|5th
\Carlton|24.3%|6th
\W. Bulldogs|24.3%|7th
\P. Adelaide|24.8%|8th
\W. Coast|25.5%|9th
\Essendon|26.0%|10th
\Gold Coast|26.3%|11th
\St Kilda|26.4%|12th
\Collingwood|26.6%|13th
\Melbourne|27.7%|14th
\Fremantle|28.3%|15th
\ Richmond | 29.1% | 16th
\Brisbane|30.3%|17th
\Hawthorn|30.9%|18th
 
In 2015 the Hawks were the stats kings, ranking highly in many categories, eons ahead of the rest of the teams. In 2016, this is no longer the case with the Hawks suffering big drops in many important categories

Stat | Haw '15 | Haw '16 | '15 rank | '16 rank
\Bounces|10.0|4.0|2nd|14th
\Disposals|394.0|367.8|2nd|10th
\Disposals per goal|23.75|24.52|1st|8th
\Goals|16.6|15.0|1st|7th
\Goal Assists|11.8|9.6|1st|8th
\Goal per inside 50|29.0%|27.5%|1st|6th
\Inside 50s|57.2|54.6|1st|8th
\Kicks|223.7|195.6|1st|12th
\Marks|102.0|80.9|1st|11th
\Marks inside 50|13.9|12.0|1st|10th
\Uncontested marks|91.5|71.0|1st|11th
\Uncontested possessions|258.8|231.4|1st|7th


Most worryingly for the Hawks is their defence which has struggled to cope with the loss of Lake and are conceding goals at an alarming rate. Goals conceded per inside 50(%) is the percentage of inside 50s conceded that result into an opposition goal, and with this metric we can clearly see that Hawthorn are the worst in the league once the ball gets into their defensive 50. Note the Top 4 teams in this metric are the current Top 4 on the AFL ladder. A co-incidence? I think not.

Team | Goals conceded / I50 | Rank
\ Sydney | 20.78% | 1st
\Geelong|22.22%|2nd
\N. Melbourne|22.46%|3rd
\GWS|22.50%|4th
\Adelaide|23.27%|5th
\W. Coast|23.78%|6th
\Carlton|24.11%|7th
\W. Bulldogs|24.38%|8th
\P. Adelaide|25.23%|9th
\Essendon|25.44%|10th
\Collingwood|26.58%|11th
\G. Coast|27.12%|12th
\St Kilda|27.23%|13th
\Melbourne|27.68%|14th
\Fremantle|28.34%|15th
\Richmond|29.24%|16th
\Brisbane|30.02%|17th
\ Hawthorn | 30.45% | 18th

Luckily for Hawthorn they have managed to limit the damage with their players further up the field managing to keep the number of inside 50s conceded to a manageable number.

Team | I50 conceded | Rank
\W. Bulldogs|40.5|1st
\Geelong|42.8|2nd
\W. Coast|46.3|3rd
\ Hawthorn | 47.6 | 4th
\GWS|50.0|5th
\ Sydney | 51.1 | 6th
\Melbourne|52.4|7th
\Carlton, N. Melbourne|52.9|eq. 8th
\Fremantle|53.4|10th
\P. Adelaide|55.0|11th
\Collingwood|55.5|12th
\Richmond|56.0|13th
\Essendon|56.5|14th
\St Kilda|57.4|15th
\Adelaide|59.6|16th
\G. Coast|60.4|17th
\Brisbane|61.6|18th

However they come up against their greatest nightmare, a side who leads the league in Inside 50s

Team | I50s | Rank
\ Sydney | 63.1 | 1st
\W. Bulldogs|59.0|2nd
\Geelong|58.6|3rd
\P. Adelaide|57.8|4th
\GWS|57.6|5th
\Melbourne|56.4|6th
\W. Coast|55.6|7th
\ Hawthorn | 54.6 | 8th
\N. Melbourne|53.1|9th
\Adelaide|51.4|10th
\Carlton|51.3|11th
\Collingwood|50.6|12th
\St Kilda|49.4|13th
\G. Coast|47.3|14th
\Brisbane|47.1|15th
\Richmond|46.9|16th
\Essendon|46.6|17th
\Fremantle|45.4|18th

Will Hawthorn seek to emulate Richmond's game plan last week for denying the Swans the ball with possession football, short kicks and uncontested marks or will they back their forward line on the open spaces of the 'G to beat the usually solid but shaky last week defence of the Swans with quick ball movement and isolated one on ones?
 

Log in to remove this Banner Ad

In this week's edition of Stats Watch, we look at the table topping, unbeaten North Melbourne Kangaroos and try to unlock the secrets to their blistering start to the year. For a side that has won all 9 games this year, it may surprise many that the Roos aren't particularly dominant in any of the key statistical categories. If we are to pick out some of these categories in Figure 1, we can see North are very good at the efficiency categories such as disposal efficiency (%) and goals per inside 50 and disposals per goal. But they below average for disposals, and despite possessing arguably the best ruckman in the competition, middle of the road for clearances.

Figure 1: Attacking stats Sydney & North Melbourne
RJB6Lrk.png


So how are North Melbourne 2 games clear at the top after almost half the season if the stats show they are a dominant team like the Hawks have been in the last 3 years? Well the answer becomes a little clearer when we look at the head to head stats in each of the 9 rounds. The rightmost 2 columns in the table of Figure 2 shows the number of times North has won that category followed by the number of times it has lost that category.

These figures reveal that while North don't stand out in any of those categories, they do enough to top their opposition in most of the categories, most of the time. In addition, while North generally concede more disposals than they win, their excellent forward half conversion (9 out of 9 for disposals per goal and 8 out of 9 for goal rate per inside 50) are the keys to their success.

Figure 2: North Melbourne head to head v opposition (click for larger version)
WghNqN0.png


In addition, the Kangaroos have shown this year they don't rely on any one player to win the game for them, having a good spread of disposal winners and goalkickers. Figures 3 and 4 highlights their spread versus the Swans.

Figure 3: Goalkicking spread
Rank | Swans | Disp | Kangaroos | Disp
\1st|Dan Hannebery|30.89|Jack Ziebell|22.89
\2nd|Josh P. Kennedy|29.25|Nick Dal Santo|22.67
\3rd|Luke Parker|28.67|Brent Harvey|21.78
\4th|Tom Mitchell|26.33|Ben Cunnington|21.11
\5th|Jake Lloyd|23.44|Sam Gibson|21.11
\6th|Kieren Jack|23.00|Daniel Wells|19.57
\7th|Lance Franklin|18.22|Andrew Swallow|19.56
\8th|Dane Rampe|18.11|Farren Ray|18.00
\9th|Jarrad McVeigh|17.83|Shaun Atley|17.33
\10th|Heath Grundy|16.89|Jamie MacMillan|17.33

Figure 4: Disposal spread
Rank | Swans | Goals | Kangaroos | Goals
\1st|Lance Franklin|37|Jarrad Waite|27
\2nd|Isaac Heeney|15|Ben Brown|18
\3rd|Kurt Tippett|15|Brent Harvey|15
\4th|Tom Papley|11|Todd Goldstein|12
\5th|Ben McGlynn|9|Drew Petrie|12
\6th|George Hewett|8|Shaun Higgins|9
\7th|Luke Parker|7|Lindsay Thomas|9
\8th|Dan Hannebery|6|Jack Ziebell|9
\9th|Callum Sinclair|6|Sam Gibson|8
 
Figure 3: Goalkicking spread
RankSwansDispKangaroosDisp

1stDan Hannebery30.89Jack Ziebell22.89
2ndJosh P. Kennedy29.25Nick Dal Santo22.67
3rdLuke Parker28.67Brent Harvey21.78
4thTom Mitchell26.33Ben Cunnington21.11
5thJake Lloyd23.44Sam Gibson21.11
6thKieren Jack23.00Daniel Wells19.57
7thLance Franklin18.22Andrew Swallow19.56
8thDane Rampe18.11Farren Ray18.00
9thJarrad McVeigh17.83Shaun Atley17.33
10thHeath Grundy16.89Jamie MacMillan17.33


Figure 4: Disposal spread
RankSwansGoalsKangaroosGoals

1stLance Franklin37Jarrad Waite27
2ndIsaac Heeney15Ben Brown18
3rdKurt Tippett15Brent Harvey15
4thTom Papley11Todd Goldstein12
5thBen McGlynn9Drew Petrie12
6thGeorge Hewett8Shaun Higgins9
7thLuke Parker7Lindsay Thomas9
8thDan Hannebery6Jack Ziebell9
9thCallum Sinclair6Sam Gibson8
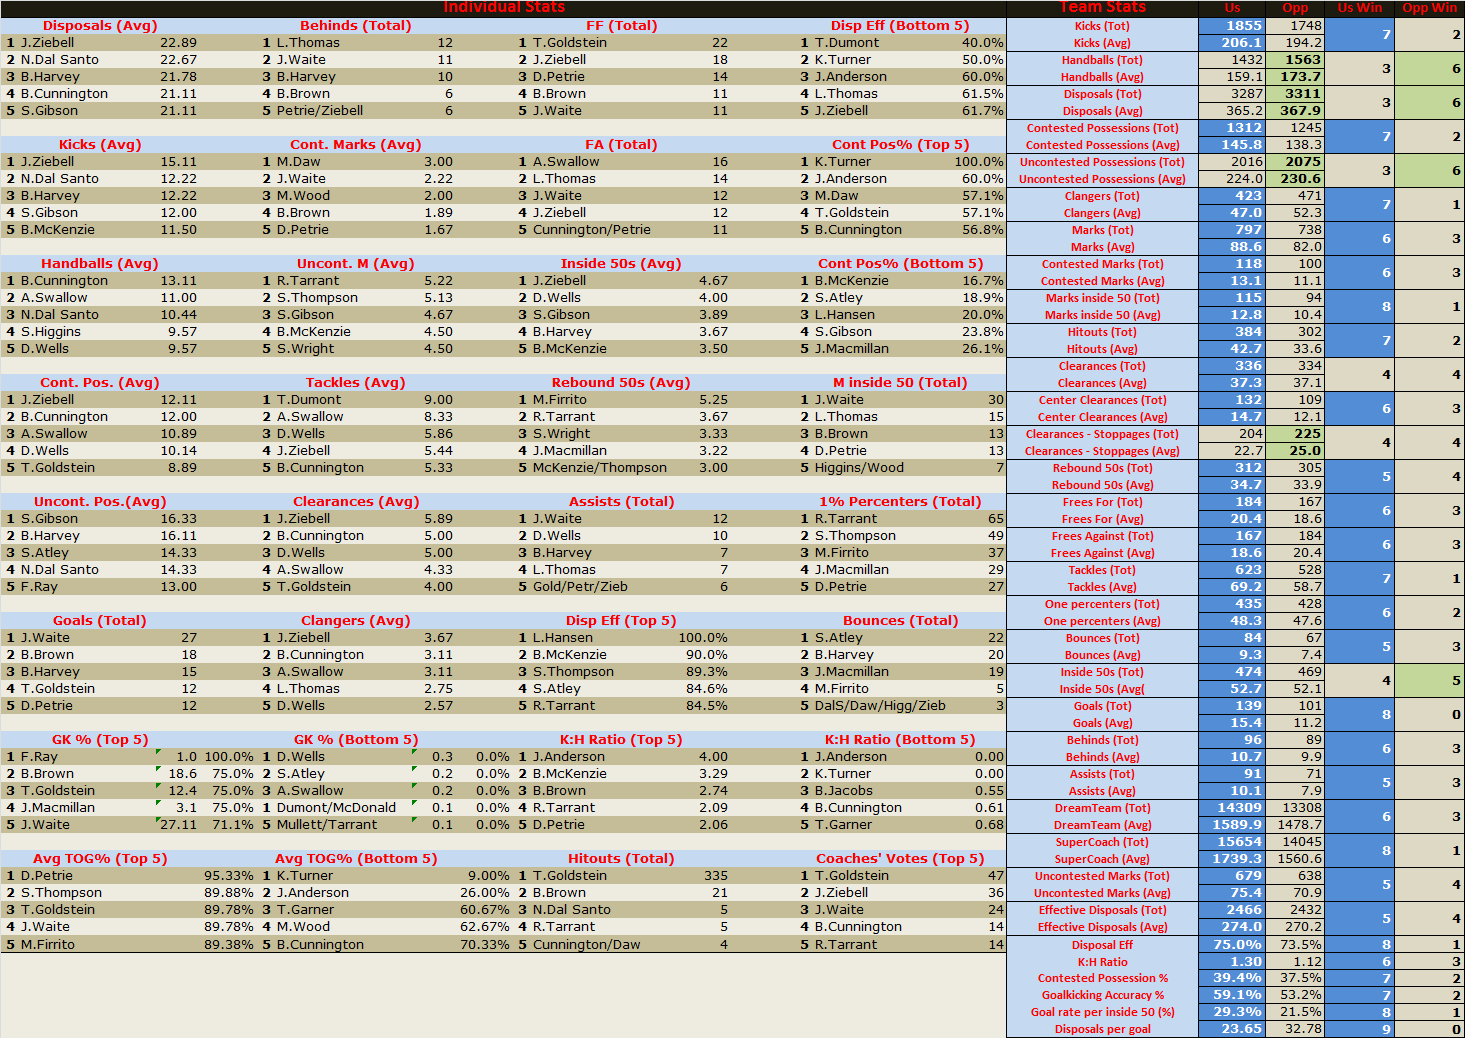
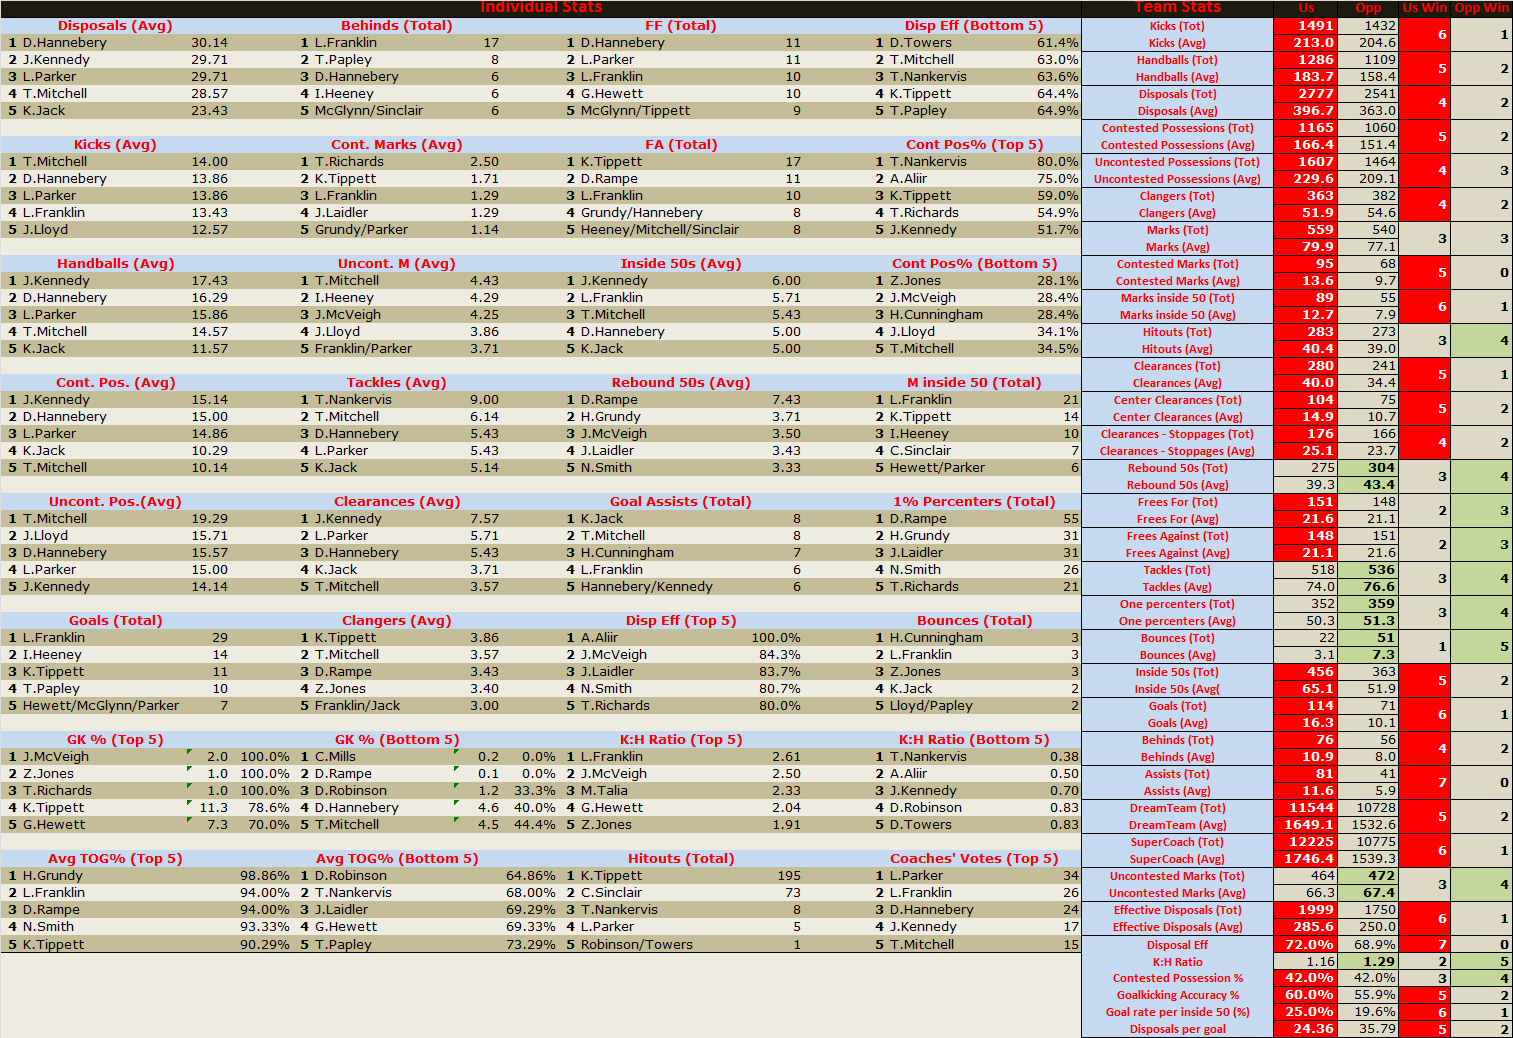
Love your work mate but I think you've labeled your tables wrong
 

Remove this Banner Ad

Centre square
For the first time in living memory, Kennedy wasn't the leader in centre bounce attendance. Instead this honour fell to Tom Mitchell, no doubt because of his tagging role on Sam Mitchell. Kieren Jack was the midfielder who sacrificed his usual inside midfield role.

v Hawthorn

Player | v | Times
\ Tom MITCHELL || 17
\|Mitchell|6
\|Rioli|3
\|Langford|2
\|Shiels|2
\|Burgoyne|1
\|Lewis|1
\|Puopolo|1
\|Smith|1
\ Josh KENNEDY || 15
\|Shiels|5
\|Langford|3
\|Lewis|3
\|Burgoyne|2
\|Mitchell|1
\|Puopolo|1
\ Luke PARKER || 12
\|Mitchell|4
\|Langford|2
\|Shiels|2
\|Breust|1
\|Burgoyne|1
\|Lewis|1
\|Puopolo|1
\ Dan HANNEBERY || 10
\|Lewis|3
\|Breust|2
\|Mitchell|2
\|Shiels|2
\|Langford|1
\ Kieren JACK || 5
\|Breust|1
\|Burgoyne|1
\|Lewis|1
\|Mitchell|1
\|Shiels|1
\ Isaac HEENEY || 3
\|Langford|1
\|Mitchell|1
\|Rioli|1
\ George HEWETT || 1
\|Lewis|1

Season to date
Player | Times
\Parker|190
\Kennedy|185
\Hannebery|125
\K.Jack|122
\Mitchell|113
\Heeney|18
\Hewett|12
\McGlynn|9
\Cunningham|4
\Robinson|3
\Franklin|1
\McVeigh|1


Rucks
Tippett continues to dominate the centre bounces, but Sinclair has taken a slightly heavier load around the ground.
v Hawthorn
Player | v | Times
\ Kurt TIPPETT || 17
\|McEvoy|9
\|Ceglar|8
\ Callum SINCLAIR || 4
\|Ceglar|2
\|McEvoy|2

Season to date
Player | Times
\Tippett|204
\Sinclair|53
\Nankervis|4

Kick ins

McVeigh now the clear main kick in taker

v Hawthorn
Player | Times
\Jarrad McVEIGH|8
\Jeremy LAIDLER|3
\Zak JONES|2

Season to date
Player | Times
\Laidler|35
\McVeigh|23
\Mills|19
\Rampe|18
\Jones|5
\Grundy|2
\Lloyd|1
\Smith|1
 
The Suns have been wracked by injuries over the past season and a half and the stats are a reflection of their woes. Most worryingly, they average the least inside 50s going forward and concede the most inside 50s in defence - which of course means they easily have the worst inside 50 differential in the league. When your opponent gets that many more opportunities in their forward 50 than your teams gets at yours, it's very, very hard to win a game of AFL.

Team | I50s For | I50s Against | I50 differential | Rank
\W. Bulldogs|57.2|42.7|+14.5|1st
\Geelong|57.3|44.8|+12.5|2nd
\West Coast|56.6|46.1|+10.5|3rd
\Hawthorn|55.2|47.2|+8.2|4th
\ Sydney | 59.6 | 51.5 | +8.1 | 5th
\GWS|56.4|51.3|+5.1|6th
\Melbourne|55.5|51.8|+3.7|7th
\P. Adelaide|57.1|55.4|+1.7|8th
\N. Melbourne|52.6|52.0|+0.6|9th
\Carlton|51.6|52.2|-0.6|10th
\Adelaide|54.4|56.4|-2.0|11th
\St. Kilda|50.7|55.1|-4.4|12th
\Collingwood|50.3|54.7|-4.4|13th
\Fremantle|45.8|51.5|-5.7|14th
\Richmond|471.|53.9|-6.8|15th
\Essendon|46.1|57.2|-11.1|16th
\Brisbane|47.1|60.5|-13.4|17th
\ Gold Coast | 44.9 | 61.4 | -16.5 | 18th

They are also pretty bad at clearances, not helped by their number 1 ruckman Tom Nicholls being out of form as well their noted midfield injury issues.

Team | Clear. For | Clear. Against | Clear. diff. | Rank
\W. Bulldogs|38.3|29.0|+9.3|1st
\GWS|39.8|33.0|+6.8|2nd
\Melbourne|39.3|35.0|+4.3|3rd
\Geelong|38.5|34.7|+3.8|4th
\ Sydney | 38.9 | 36.1 | +2.8 | 5th
\West Coast|38.9|37.0|+1.9|6th
\Richmond|37.3|36.2|+1.1|7th
\Adelaide|38.2|37.8|+0.4|eq. 8th
\N. Melbourne|38.2|37.8|+0.4|eq. 8th
\Fremantle|36.3|36.1|+0.2|10th
\Hawthorn|39.1|40.7|-1.6|11th
\St. Kilda|37.0|38.7|-1.7|12th
\Essendon|33.4|35.6|-2.2|13th
\Collingwood|33.1|35.4|-2.3|14th
\Carlton|33.8|37.1|-3.3|15th
\P. Adelaide|39.2|43.0|-3.8|16th
\ Gold Coast | 31.8 | 37.9 | -6.1 | 17th
\Brisbane|33.4|43.4|-10.0|18th

But enough about the Suns, we could go on talking about how terrible they've been - it makes for depressing discussion. Let's talk instead about the Swans and the most recent 3 rounds.

In Round 1-7 the Swans were the clear leaders in generating inside 50s, averaging a whopping 65.1 per game. The last 3 weeks, against tougher opponents, have seen a significant drop to 46.7 per game. The number of clearances have also fallen: the Swans only lost the clearance count in 1 of the first 7 rounds (Round 4 v Adelaide) but have lost the last 3, including season worsts in clearances won (28 v Richmond in Round 8) and clearances lost (46 v N. Melbourne Round 10). The Swans will be hoping to reverse the trend in these 2 important categories on Saturday.
 
The number of clearances have also fallen: the Swans only lost the clearance count in 1 of the first 7 rounds (Round 4 v Adelaide) but have lost the last 3, including season worsts in clearances won (28 v Richmond in Round 8) and clearances lost (46 v N. Melbourne Round 10). The Swans will be hoping to reverse the trend in these 2 important categories on Saturday.
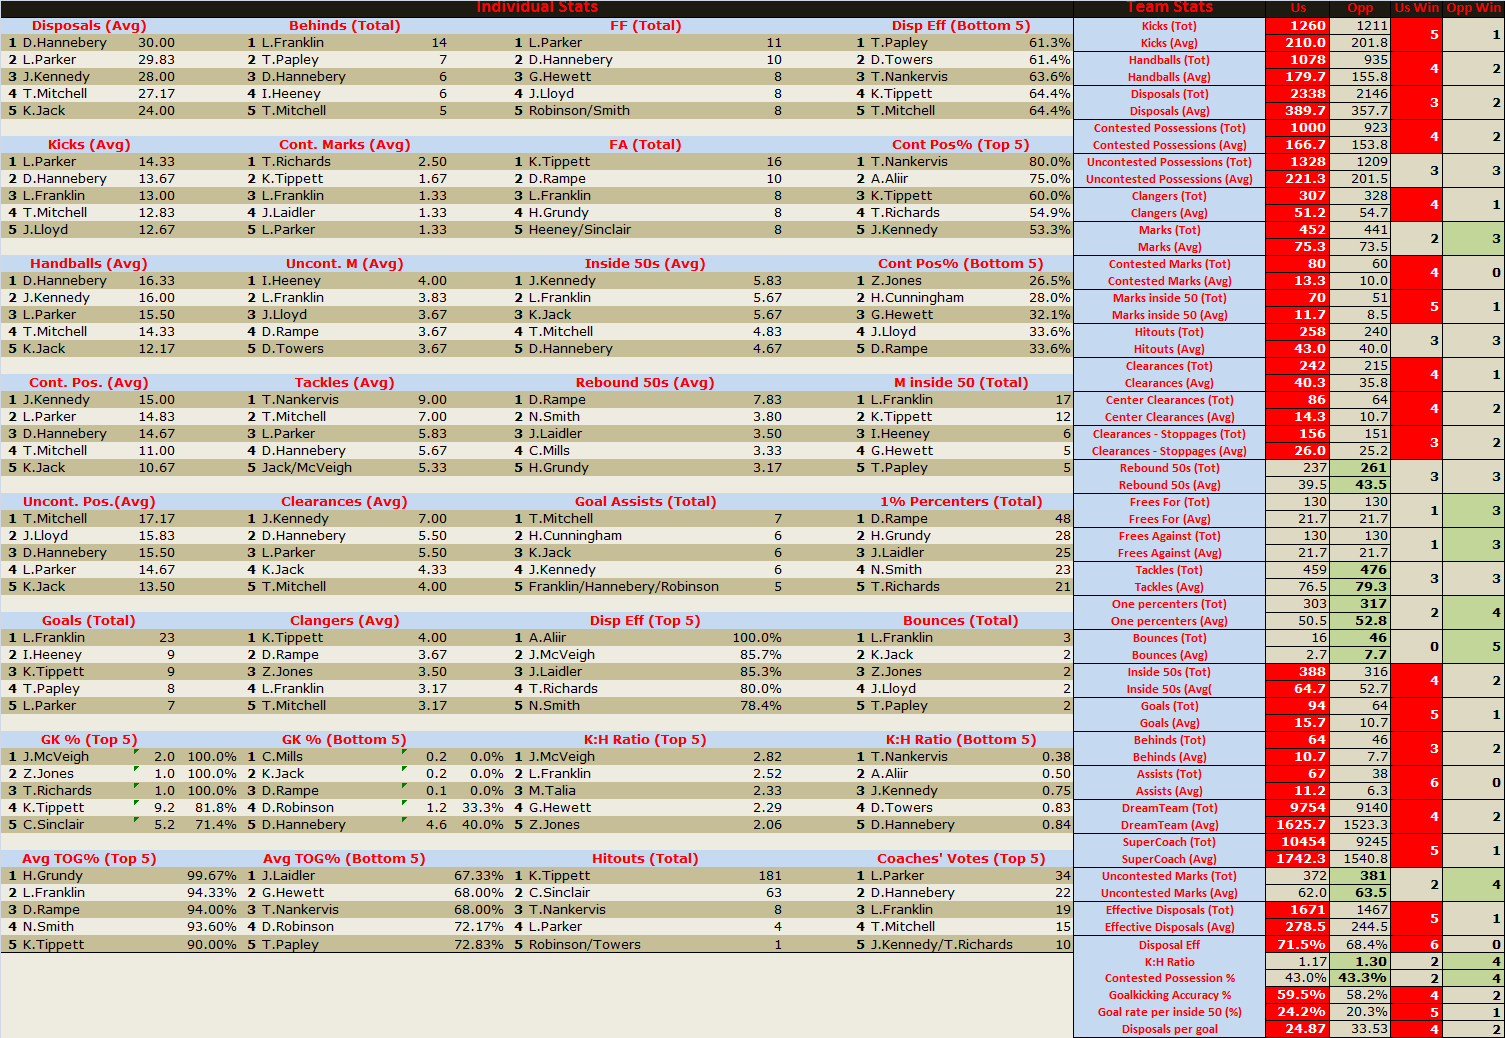
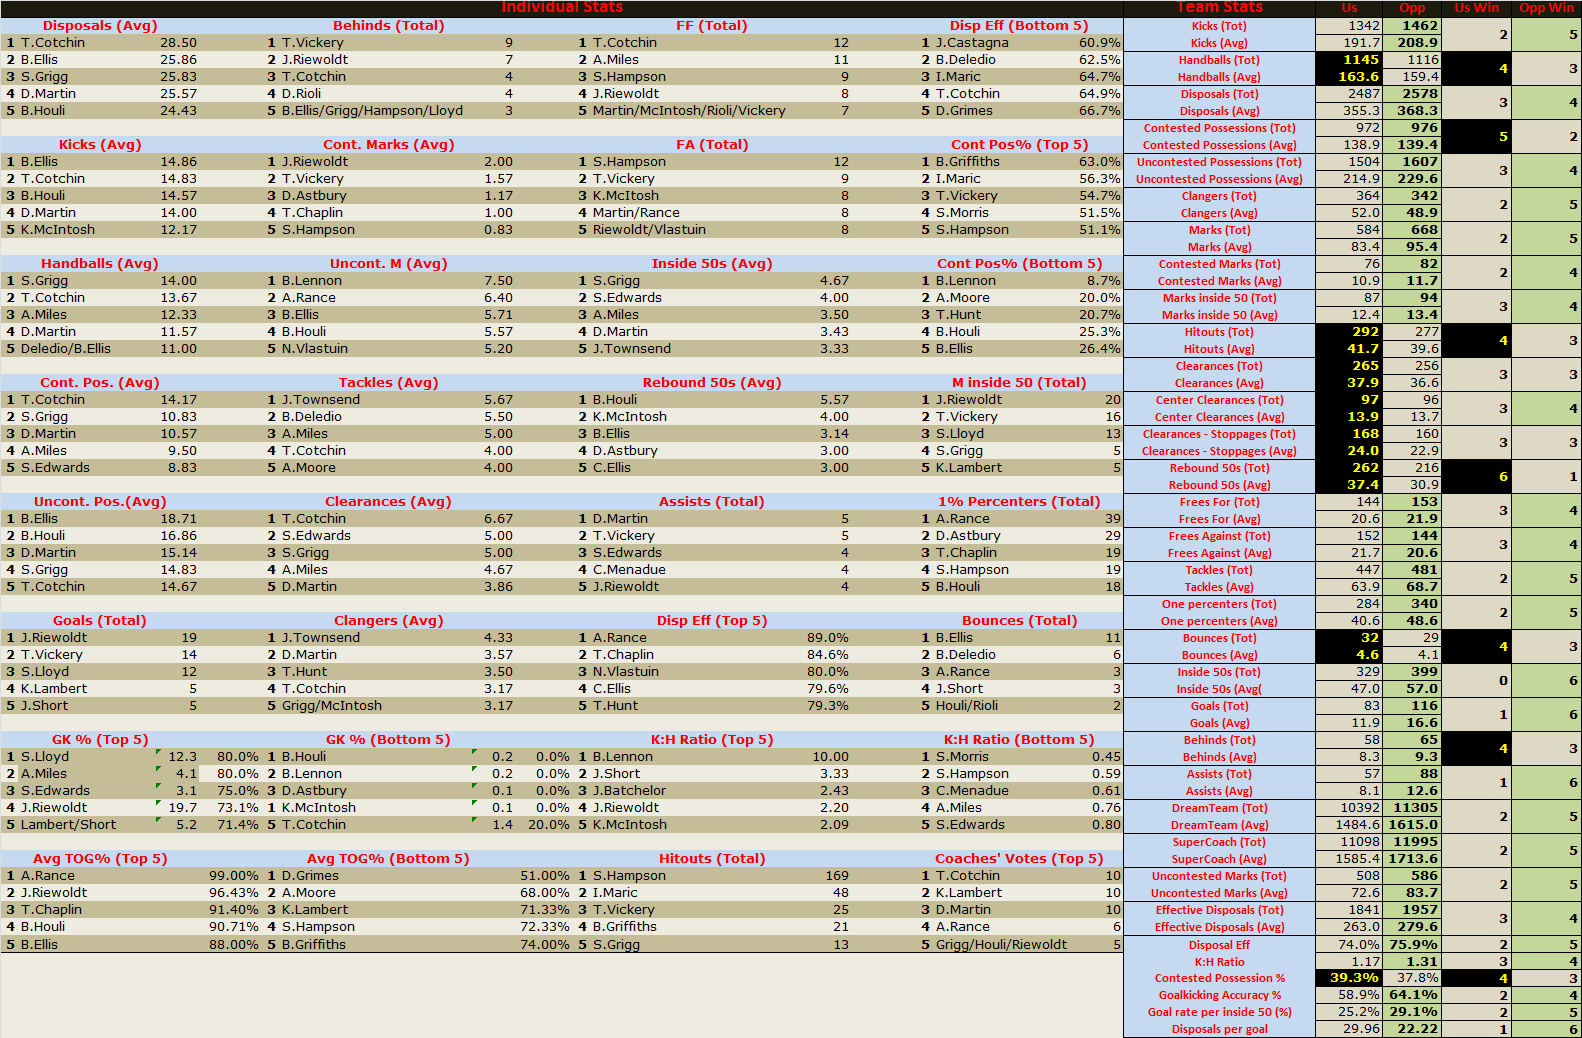
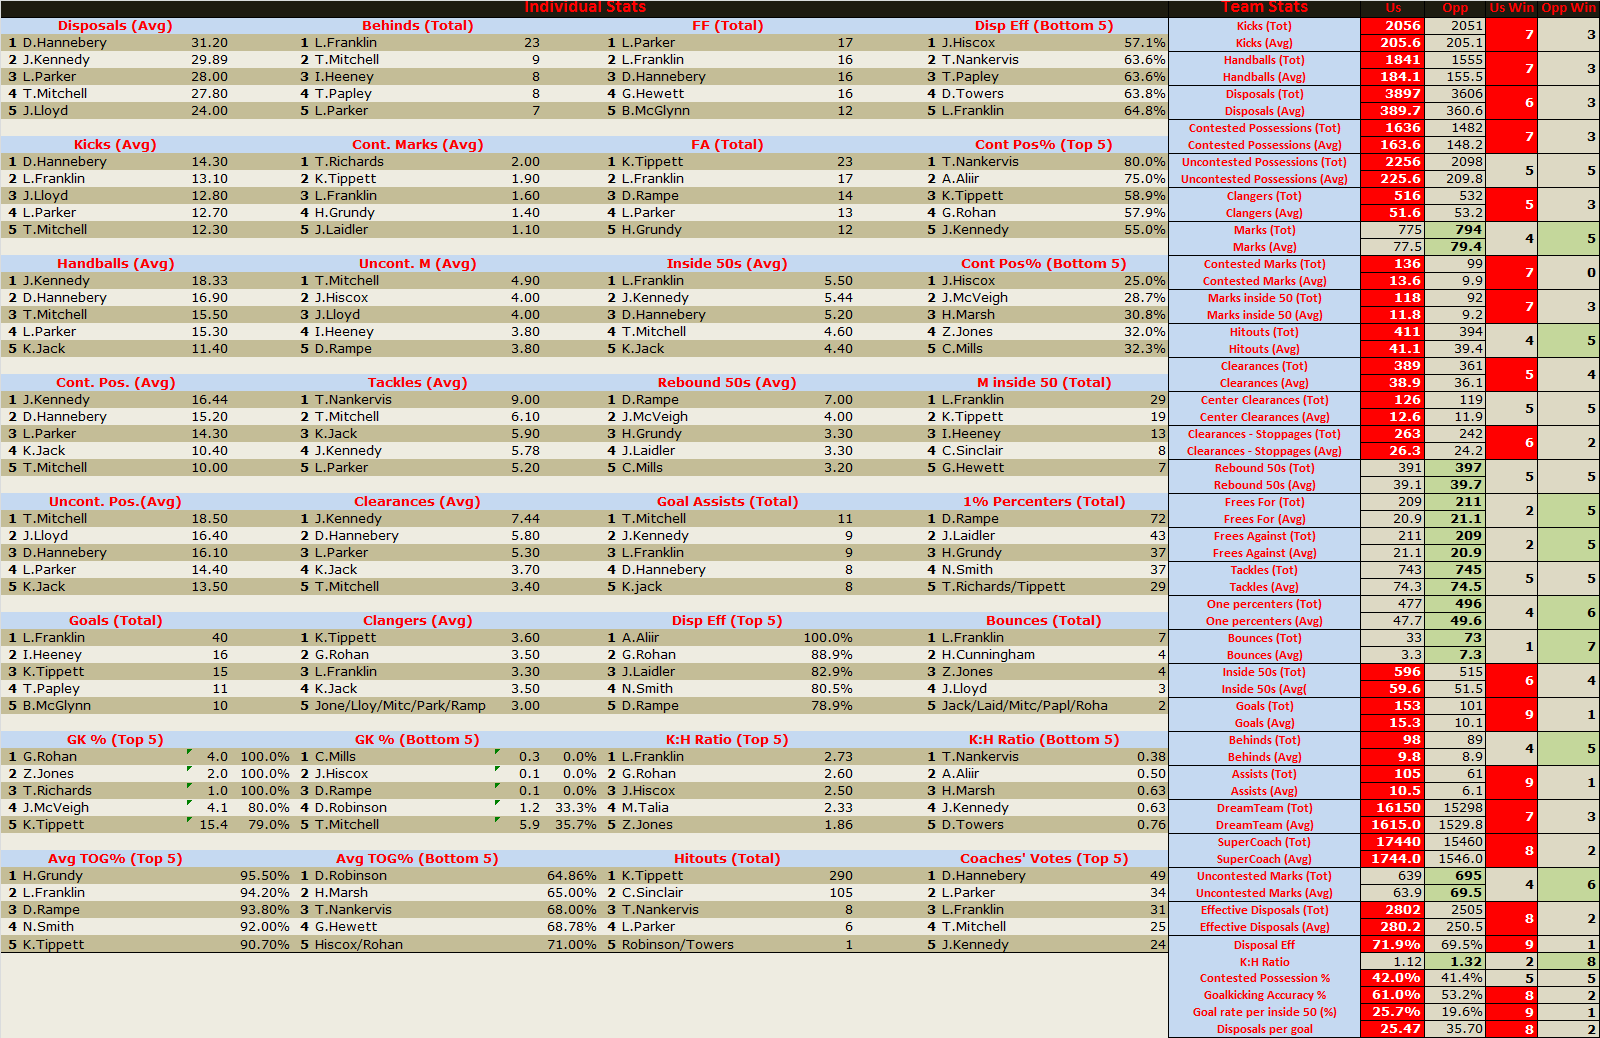
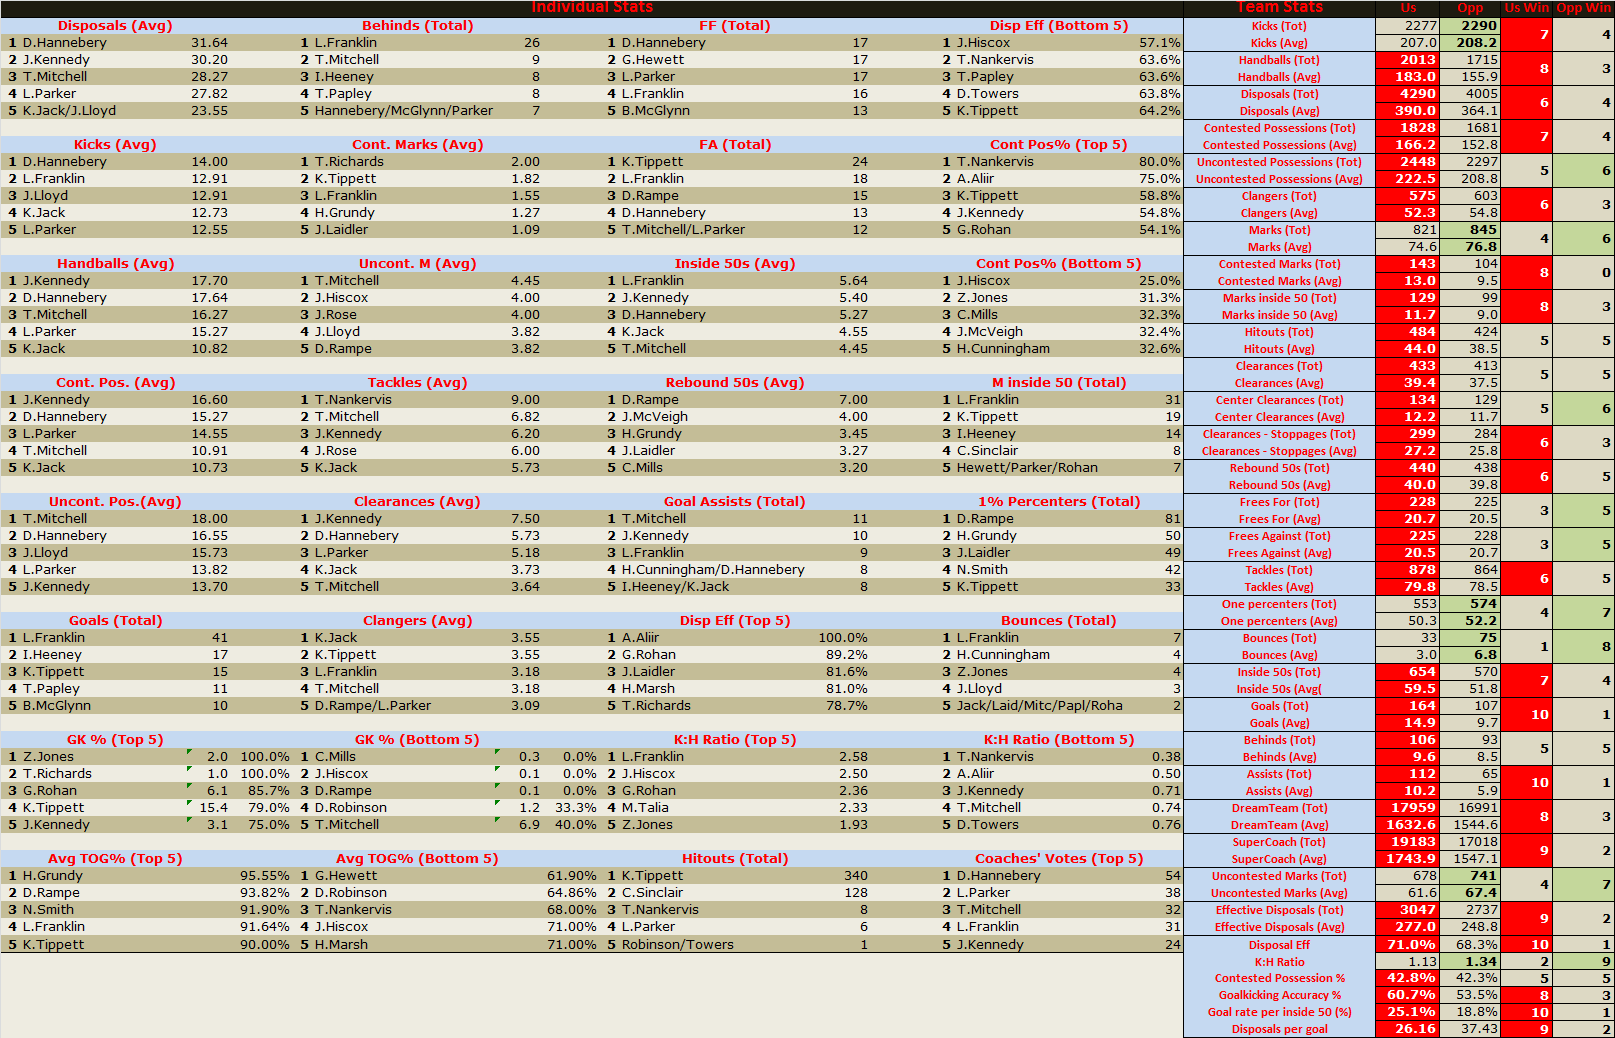
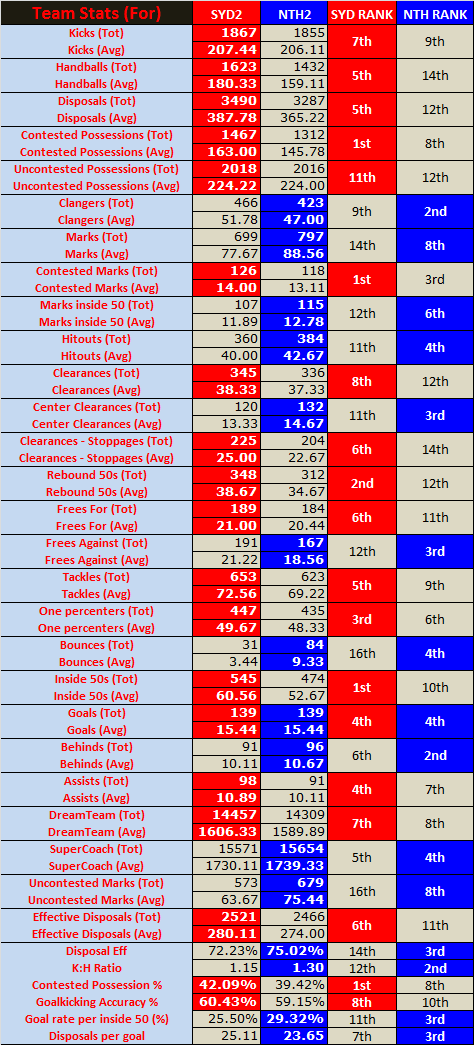
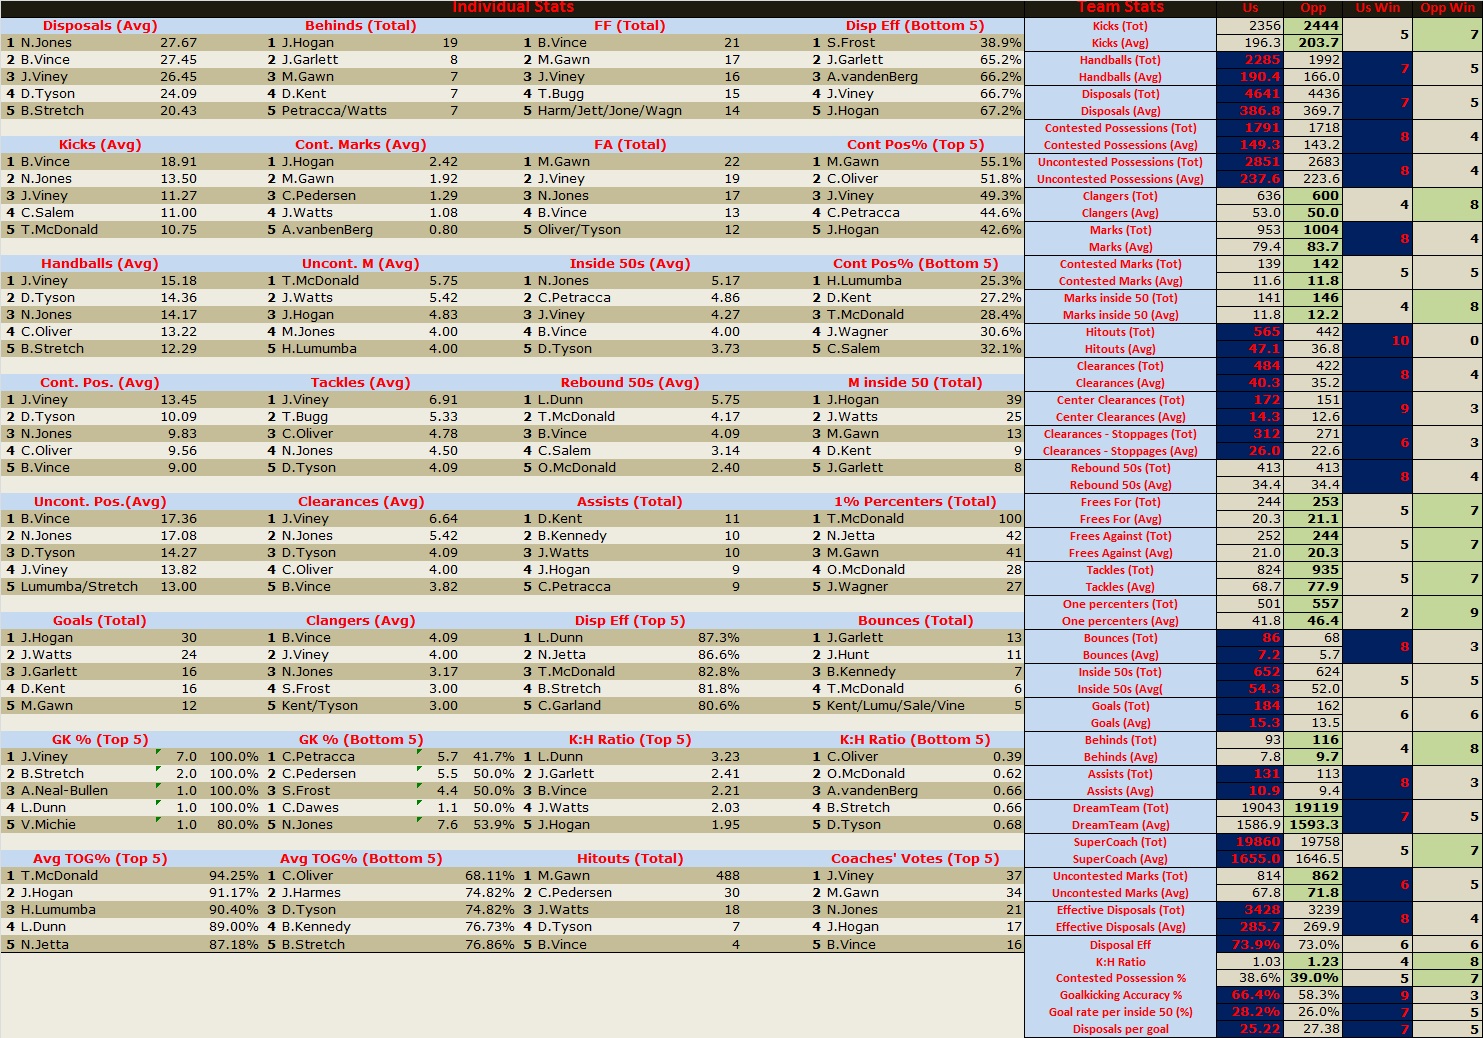
I thought that was the case. I wonder why. Just tougher midfields or laziness?
 
Center square

After an extended run in the middle last week for Mitchell, it was a return to the status quo with Jack coming back to the inside. One slight change is Parker, who is 2nd at center bounce attendance, only having 14 for this game.

v North Melbourne


Player | v | Times
\ Josh KENNEDY || 24
\|Wells|9
\|Ziebell|5
\|Cunnington|4
\|Swallow|3
\|Dal Santo|2
\|Dumont|1
\ Kieren JACK || 17
\|Cunnington|6
\|Ziebell|5
\|Dumont|2
\|Swallow|2
\|Wells|2
\ Dan HANNEBERY || 14
\|Swallow|6
\|Dumont|3
\|Cunnington|2
\|Dal Santo|1
\|Wells|1
\|Ziebell|1
\ Luke PARKER || 14
\|Cunnington|4
\|Ziebell|4
\|Dal Santo|2
\|Swallow|2
\|Dumont|1
\|Wells|1
\ Tom MITCHELL || 11
\|Dal Santo|3
\|Ziebell|3
\|Wells|2
\|Cunnington|1
\|Dumont|1
\|Swallow|1
\ George HEWETT || 1
\|Swallow|1

Season to date
Player | Times
\Kennedy|209
\Parker|204
\Hannebery|139
\K.Jack|139
\Mitchell|124
\Heeney|18
\Hewett|13
\McGlynn|9
\Cunningham|4
\Robinson|3
\Franklin|1
\McVeigh|1

Rucks
v North Melbourne

No change here with Tippett battling it out with Goldstein for the majority of the game

Player | v | Times
\ Kurt TIPPETT || 21
\|Goldstein|20
\|Brown|1
\ Callum SINCLAIR | 6
\|Brown|3
\|Goldstein|3

Season to date
Player | Times
\Tippett|225
\Sinclair|59
\Nankervis|4

Kick ins
v North Melbourne

Rampe and Mills have been put on ice, with neither taking a kick-in in the last 2 games. Rohan took the last kick in for the lolz.

Player | Times
\Laidler|5
\McVeigh|5
\Rohan|1

Season to date
Player | Times
\Laidler|40
\McVeigh|28
\Mills|19
\Rampe|18
\Jones|5
\Grundy|2
\Lloyd|1
\Rohan|1
\Smith|1
 
Until their consecutive loses in the past two weeks, the Giants were getting fulsome praise in the media and had even been tagged by some experts in the media as flag hopefuls despite having never qualified for the finals. They were portrayed as a gun attacking side, full of run provided by their arsenal of young runners who could devastate other sides with their gut running and explosion from stoppages. The offensive stats seem to back up this claim.

The Giants are 3rd in disposals, 2nd in marks, 1st in clearances and bounces and 2nd in goals, clearly topping the Swans in all those categories. They are also incredibly efficient with the footy in hand, ranking 4th in disposal efficiency, 2nd in goalkicking accuracy, 2nd in goals per inside 50 as well as being 4th in disposals per goal. Incredibly numbers that Swans fans can only dream about our own team achieving. The comparable numbers can be seen in Figure 1.

Figure 1: Offensive stats
Hv8WvTz.png


By contrast, the Swans excel in the defensive side of the games, ranked number 1 in uncontested possessions conceded and goals conceded also ranking first in opposition disposal efficiency (against), opposition goalkicking accuracy (against), opposition goals per inside 50 (against) and opposition disposals per goal (against). While the Giants aren't too bad in these categories, ranking slightly above the league average, they can't be compared to the Swans who are not only the best in the AFL, but are putting together a defensive performance that ranks as one of the best in the last 15 years.

Figure 2: Defensive stats
vCdG18Q.png


As with most games, the key battle looms in the midfield. The Giants' impressive brigade of young onballers backed by a dominant presence in ruckman Shane Mumford have the 2nd best clearances differential in the competition, behind another band of precocious youngsters in the Western Bulldogs.

While the Swans don't mind getting repeat stoppages and slowly wearing teams down, the Giants like winning the ball and getting it their outside runners with the likes of Kelly, Scully, Whitfield, Shaw, Wilson and Williams all providing great options on the wing or on the flanks.

Figure 3: Clearance differential

Team|Clear. For|Clear. Agst|Clear. Diff.|Rank
\W. Bulldogs|38.0|29.1|+8.9|1st
\ GWS | 40.4 | 34.5 | +5.9 | 2nd
\Melbourne|40.4|35.4|+5.0|3rd
\Geelong|39.5|35.7|+3.7|4th
\ Sydney | 39.4 | 37.5 | +1.8 | 5th
\Richmond|37.8|36.1|+1.7|6th
\Adelaide|37.7|36.4|+1.4|7th
\West Coast|38.1|36.8|+1.3|8th
\Fremantle|36.4|35.5|+0.8|9th
\N. Melbourne|37.9|38.3|-0.4|10th
\Collingwood|32.4|34.6|-2.3|11th
\Hawthorn|39.1|41.6|-2.5|12th
\St Kilda|35.6|38.2|-2.5|13th
\Essendon|33.1|35.7|-2.6|14th
\Port Adelaide|38.1|41.4|-3.3|15th
\Carlton|33.0|37.5|-4.5|16th
\Gold Coast|33.6|38.5|-4.8|17th
\Brisbane|34.2|41.7|-7.5|18th
 

🥰 Love BigFooty? Join now for free.

The Swans excel in the defensive side of the games, ranked number 1 in uncontested possessions conceded... goals conceded... opposition disposal efficiency (against), opposition goalkicking accuracy (against), opposition goals per inside 50 (against) and opposition disposals per goal (against)

...

The Swans who are not only the best in the AFL, but are putting together a defensive performance that ranks as one of the best in the last 15 years.
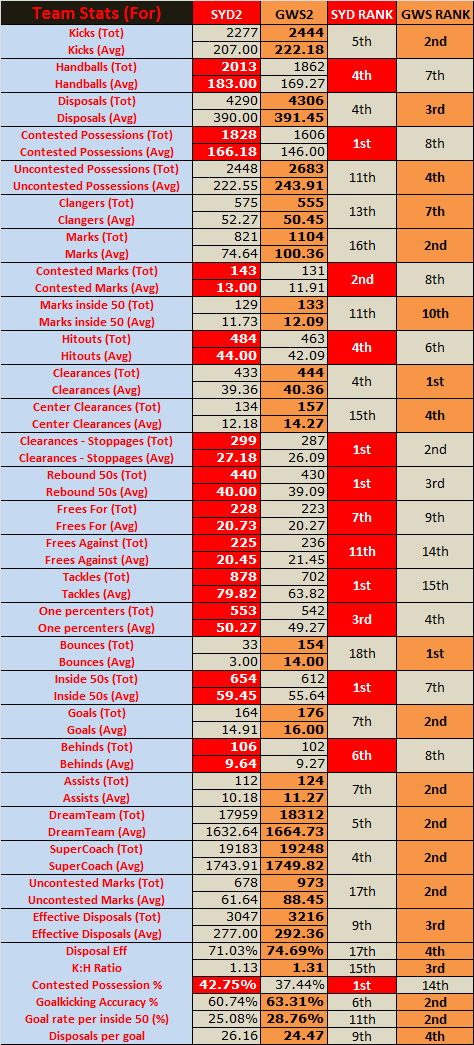
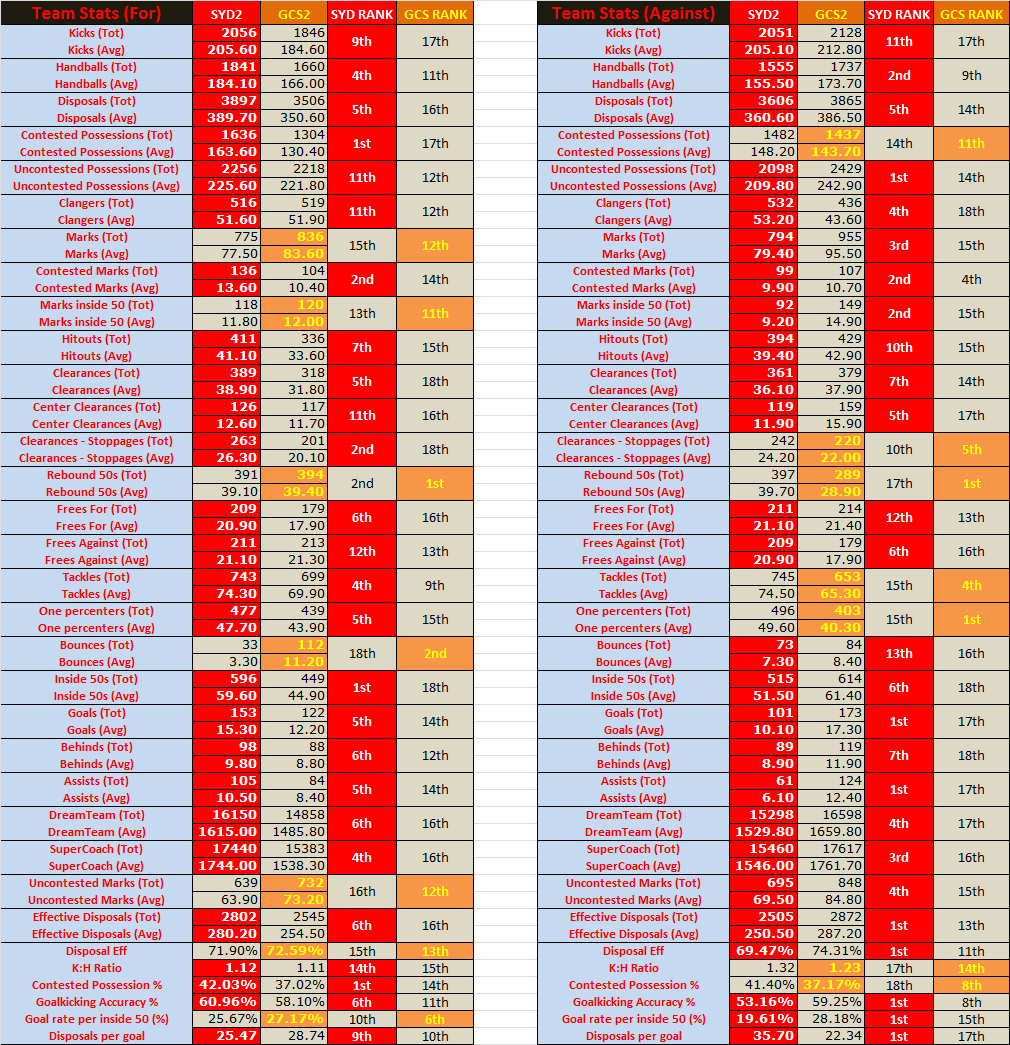
It's the injection of Heeney, Papely, Robo, Hewett, Sinkers, Jones & Mills which has meant we are more flexible & it's showing in this years strong results. Particularly from a defensive perspective. Not to mention Grundy in career best form. Rampe in career best form. Laidler & Smith both ridiculously consistant. Mills a sensational output from a rookie. Jones in Career best form.

It's also been the pressure applied up the ground which has made a difference this year IMO. With Heeney, Buddy, Paps, Benny, Hewett & 1 of Sinkers/Tippo really working hard up fwd it's allowed our midfielders to push back more this year & help out. Instead of relying on just Bud/Tip/midfield to kick our goals, guys like Cunners, Hanners, Titch, Macca, Jack etc can be more defensivly minded & put more pressure on behind the centre square.
 
Defensive. Dour. Gritty. These are the adjectives that are commonly heard to describe Paul Roos coached teams, with Swans fans no strangers to the common criticisms leveled at our former coach. For the first 2 years of his Melbourne tenure, those same barbs were thrown at Roos's direction but the stolid ex-Fitzroy man took in his stride and defended his coaching philosophies saying he had to build the defensive foundations first and foremost.

This year has seen an explosion from the multipronged Melbourne forward line, with young gun Jesse Hogan (30 goals) leading way and supported by the improving Jack Watts (24), small forwards Jeff Garlett and Dean Kent (16 each) as well as the continued improvement of ruckman Max Gawn (12). They have propelled Melbourne from the 3rd lowest scoring team in 2015 to the 3rd highest scoring team in 2016 with an incredible 50% improvement from 2015 (see Table 1). This is the greatest improvement of any side in the AFL this season and one sure to cause consternation among the Swans coaching hierarchy.

Table 1: Goals
Team | 2015 Ave. Goals | 2016 Ave. Goals | Goals Diff. | Diff Rank | 2016 Rank
\ Melbourne | 10.2 | 15.3 | +5.1 | 1st | 3rd
\GWS|12.2|15.9|+3.7|2nd|2nd
\Adelaide|14.7|16.8|+2.1|3rd|1st
\Geelong|13.0|15.0|+2.0|4th|5th
\St Kilda|11.0|12.6|+1.6|5th|11th
\Gold Coast|10.7|11.9|+1.2|eq. 6th|14th
\Port Adelaide|13.5|14.7|+1.2|eq. 6th|7th
\Carlton|10.0|11.1|+1.1|eq. 8th|16th
\ Sydney | 13.3 | 14.4 | +1.1 | eq. 8th | 9th
\N. Melbourne|13.8|14.8|+1.0|10th|6th
\Brisbane|10.2|10.7|+0.5|11th|17th
\Richmond|12.7|12.3|-0.4|12th|12th
\Fremantle|12.4|11.6|-0.8|eq. 13th|15th
\W. Bulldogs|14.1|13.3|-0.8|eq. 13th|10th
\West Coast|15.5|14.7|-0.8|eq. 13th|7th
\Collingwood|13.0|12.0|-1.0|16th|13th
\Hawthorn|16.6|15.2|-1.4|17th|4th
\Essendon|10.3|8.2|-2.1|18th|18th

While the improvement from the likes of Gawn, the much maligned Watts and their young but impressive midfield has been a big reason for this improvement, the biggest catalyst from a statistical point of view has been their goalkicking accuracy. Melbourne were the worst team in 2015 for goalkicking accuracy kicking 225 goals and 182 behinds for an accuracy of 55.8%. So far in 2016 this accuracy has risen to a league high of 66.4% (184 goals and 93 behinds) that is a good 3.5% than the next best team West Coast (62.86%). See Table 2 for more details

Table 2: Goalkicking accuracy (%)
Team | 2015 GK% | 2015 Rank | 2016 GK% | 2016 Rank
\ Melbourne | 55.28% | 18th | 66.43% | 1st
\West Coast|58.72%|11th|62.86%|2nd
\Hawthorn|63.70%|1st|62.76%|3rd
\GWS|55.83%|17th|62.21%|4th
\Adelaide|60.99%|8th|60.91%|5th
\St Kilda|56.18%|14th|60.64%|6th
\W. Bulldogs|62.63%|3rd|60.15%|7th
\ Sydney | 59.47% | 10th | 60.07% | 8th
\N. Melbourne|61.71%|4th|59.93%|9th
\Gold Coast|56.63%|13th|59.83%|10th
\Richmond|59.70%|14th|58.50%|11th
\Carlton|56.15%|15th|58.33%|12th
\Port Adelaide|63.52%|2nd|58.28%|13th
\Collingwood|61.19%|7th|57.37%|14th
\Geelong|61.54%|5th|55.38%|15th
\Fremantle|61.21%|6th|55.38%|16th
\Brisbane|57.58%|12th|52.89%|17th
\Essendon|55.94%|16th|52.69%|18th


77rG07u.png

nQSkZbz.png

1pONEts.png
 
Does that say we're 18th in the league for disposal efficiency? And somehow 3rd on the ladder.
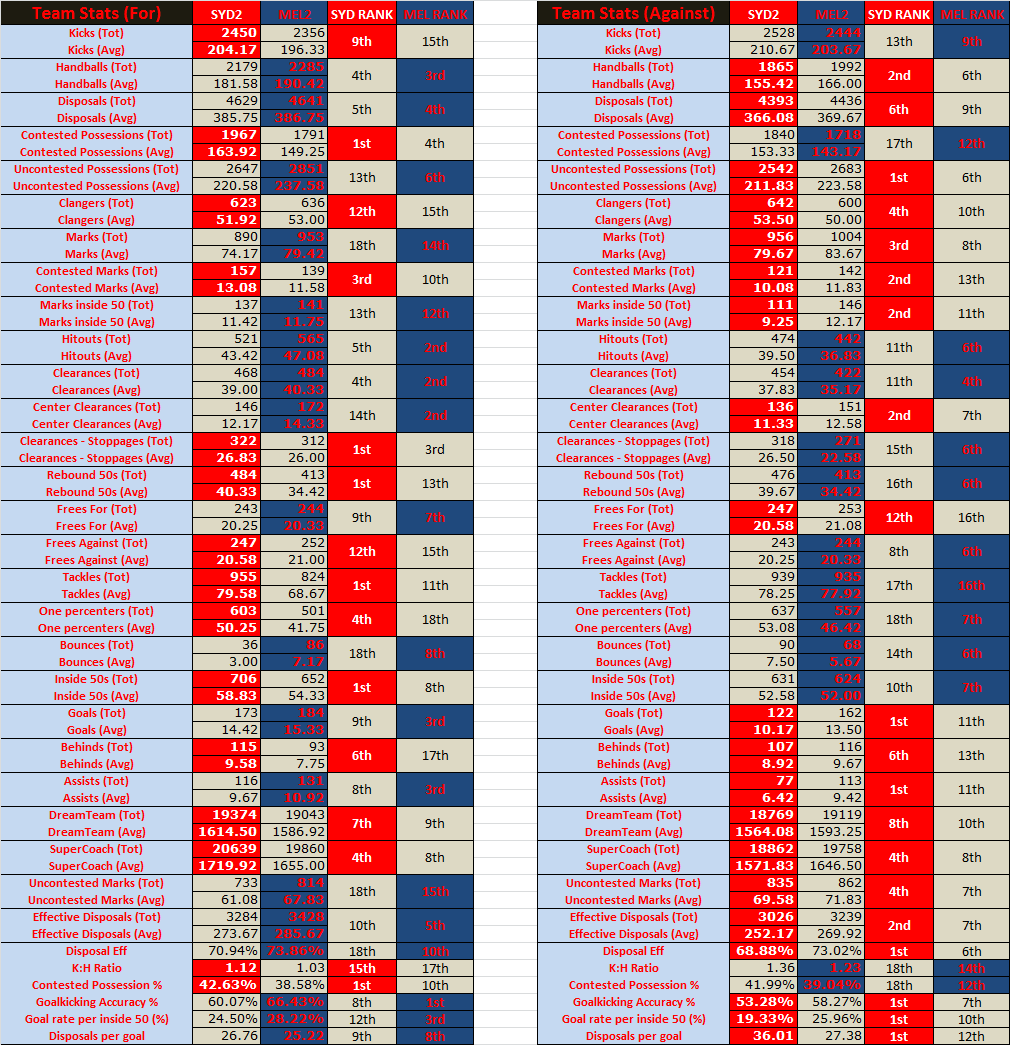
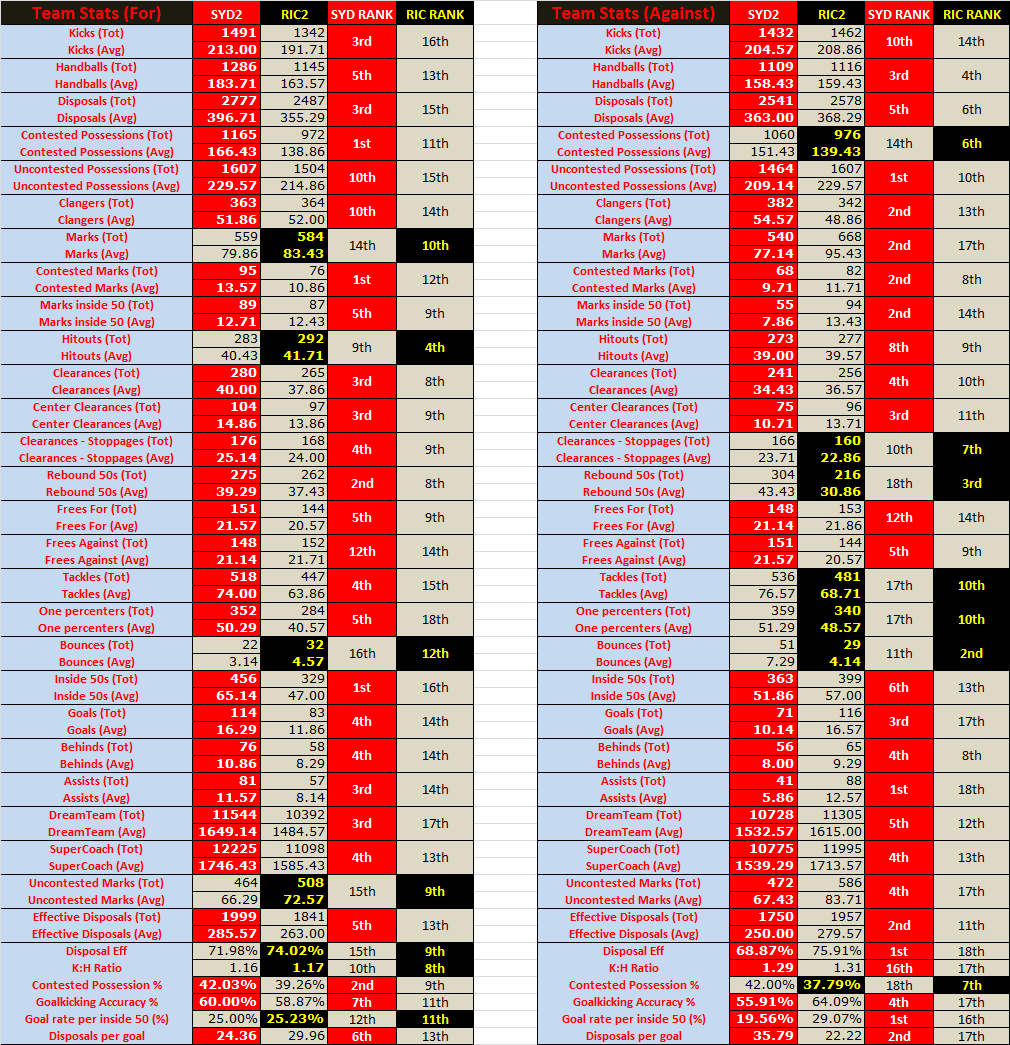
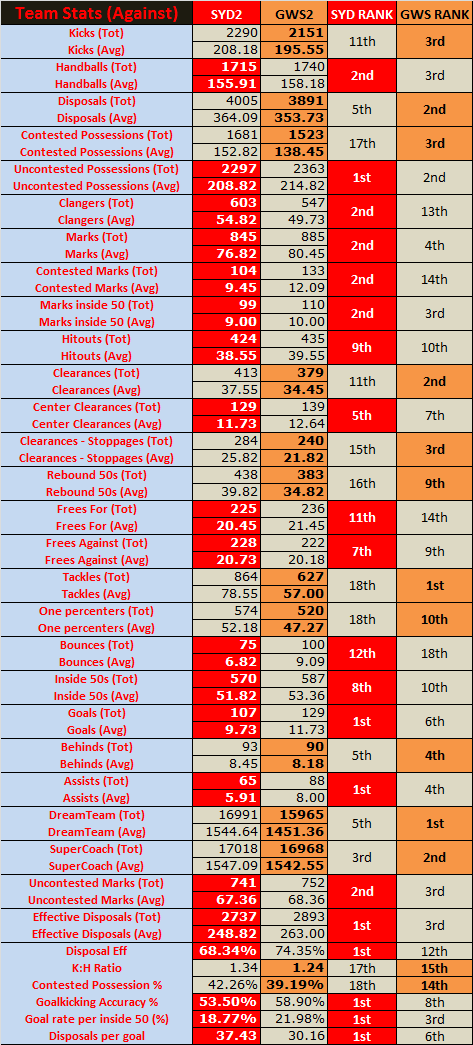
Yep, and we let our opposition have the worst disposal efficiency in the league based on the above stats too. So basically we turn every game into a shankfest
 
Does that say we're 18th in the league for disposal efficiency? And somehow 3rd on the ladder.
Yes but you have to take into consideration that we play the most contested style in the league. More ball in contested, tight situations leads to less accuracy. Also take note that we are also the number 1 side in disposal efficiency against. i.e. teams that play us average the least efficient disposals - so perhaps that's an explanation of why we are 3rd on the ladder.

It's like that old saying, you don't need to outrun the bear, you just have to outrun the other guy.

Edit: what swansfan51 said.
 

Remove this Banner Ad

Mega Thread The Stats Thread

🥰 Love BigFooty? Join now for free.

Back
Top