Umpiring

Are they?

  • Yes

    Votes: 47 51.6%
  • No

    Votes: 16 17.6%
  • They will until this group has officially been broken, Hardwick aint Coach and Gale isn't CEO

    Votes: 28 30.8%

  • Total voters
    91

Remove this Banner Ad

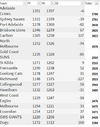
Free Kicks FOR Ladder, (in the Top 164 players in the league)

Port 14 players
Freo - 12
Coll / North - 11
Gold C. - 10
Ess / Swans / Carl / Bris / Swans - 9
Adel - 8
Melb / GWS / Haw - 7
St.K / W.C - 6
Dogs / Geel - 5
Rich - 2

(Nank & Vlastuin)

Sounds about right.
So many stat sheets showing up the rorting of the umpires.
They have nowhere to hide now.
CFL have blood on their hands over this issue as well.
Makes complete sense that the only team that would cop a wrath of rule changes would be us.
 

Log in to remove this ad.

Will look on with interest next few weeks, htb in particular has been a media focus , all games feature bowlers that don’t get paid , there’s a new umpires trainer , Steve mcburnie, dunno if that’ll help at all
Another explanation is that clubs play for frees , blues are one coz Voss would play like that , exaggerate contact , make sure umpire sees it , remember what butters did a few weeks ago critical moment slight contact went down like he was hit with a sledge hammer that’s how sides are getting > avg number of frees
 
As mentioned on the show tonight, I was sent a message advising the coterie members from various groups have had a gut full and reached out to Gale today saying enough is enough.

Allegedly Gale has since organised a meeting with the afl for this week.
Gale should just read out the unbelievable stats and say that he can't even put into words how he feels about it....,
but Neil Balme can..., and have him unleash hell on those cheating corrupt farkers!!!!

Oh wait...., didn't he already do that.
 
All started with Peter McKenna... Have a listen to the commentary...


Watched a bit of that, how enjoyable.
No stupid deliberate, players weren't worried about giving away 50m.
Game wasn't over umpired, they made mistakes and missed frees but didn't just pay a free for slight contact.
I just take away from it how over controlled the game has become.
For decades now they have been trying to fix problems with the game when there wasn't really a problem in the first place.
 
That meeting will go nowhere due to the fact I can almost guarantee you he doesn't have the right numbers or the right questions to ask.

What Gale needs to show the AFL is:
1. Each clubs Frees Against (the ones they give away) statistics over the last year years. I am in the middle of the same analysis and from what I am seeing is that apart from a few teams like Hawthorn, every team on average is on significantly better behaviour against us. What he also should show is the number of frees that interstate teams give away at the G against us VS against other sides. Again, the interstate teams seem to be on fantastic behaviour against us at the G but get done in against other teams

2. Average Numbers of total frees per game. This is to dispute the argument that "Well your players are just so undisciplined that's why you are constantly at the bottom". Cool story bro, why is it then that we average around the middle of the pack for total frees per game? If we are just giving them away so much shouldn't our frees per game be so much higher?

3. The VFL free kick stats and compare them to the AFL. This would also shut up the "gamestyle" tools because if we are so undisciplined then how come the VFL team has a different free stats? Also do the umpires in the VFL have the same training?

Lastly the questions that should be ask are;
1. After seeing the data are you able to see our point of view?
2. If you were to put your finger on why this is happening what would be your view?
3. We would like to view and each and every piece of vision that the umpires have used for training for the last 3 years. <-- This is not really a question here but it is a request. The club needs to get their hands on this and just do a simple count of the times the vision includes a Tiger player giving away a free kick or being the player in the wrong. If that number is high and a lot higher than the rest of the other teams, we can say to the AFL that they are clearly conditioning their umpires to view Richmond players in a negative light.
I hope Gale does the meeting in the style of Chopper Read


(Log in to remove this ad.)

In a number of games this year we have have had almost no free kicks paid for whole quarters. I think it was the Saints game we were given nothing in the third QTR and on the weekend we were given two in the third, one of those being an out on the full free 🤣
We were 4-16 down at 3/4 time against the Weagles.

Then the umps loaded us up with a 7-for in the last quarter, including three in the first 2 minutes.

None forward of centre, of course.
 
We were 4-16 down at 3/4 time against the Weagles.

Then the umps loaded us up with a 7-for in the last quarter, including three in the first 2 minutes.

None forward of centre, of course.

The pattern is getting pretty predictable isn't it. Go hard until the game is out of reach then pad the stats so it doesn't look as bad.
 
Focus of discussion missed frees
High , apparently baker hasn’t got a head
In the back
Delib that only applies to us
Trips
Throws
What about when the ******* umpires bounce it & goes outside the circle? Is that because the ball is an odd shape, insufficient attempt to keep it in or deliberate? I’m done, I’ll keep paying for 6 memberships but that’s it. I don’t watch anymore on tv & don’t watch any footy shows. Shove it up ya arse AFL & anything that rhymes with Gillion, Dillon or Million. heck u to Geelong & Carlton
 
Exactly this Shaky. Even if we are undisciplined, that doesn’t explain why we don’t get paid the free kicks we should. No one is disputing most of the ones against us.

There was one match where we had only received 3 free kicks up to 3/4 time. How is that possible if the game is being umpired fairly? I don’t believe any side would only infringe 3 times in 3 quarters. Just rubbish.
The very simple counter question to Ralphy is that if it is a discipline issue then why are we not number 1 in total Free total per game?

If anyone says the undisciplined line to you, simply ask them "If we are being umpired fairly but we just play in an undisciplined fashion like you claim, Richmond games should be the games that the umpires blow the whistle the most right? Well when you stack up the numbers from that article for the years mentioned has us as 11th on the list for average total number of frees per game. It is actually the Crows games the the umps are invested in the most"

1715094085067.png
 
I posted this on a thread on the main board very relevant to this thread:


....A lot of your reasoning there sounds perfectly reasonable in isolation.

Let's however look at some facts. These are the teams to have the worst average free kick differential each year from 1965 to 2024. Interesting reading.

VFL era Free kick differential wooden spooners:

1965 Geelong VFL #12
1966 Geelong VFL #12
1967 Geelong VFL #12
1968 Richmond VFL #12
1969 Carlton VFL #12
1970 Carlton VFL #12
1971 Hawthorn VFL #12
1972 Hawthorn VFL #12
1973 Hawthorn VFL #12
1974 Hawthorn VFL #12
1975 Hawthorn VFL #12
1976 Hawthorn VFL #12
1977 North Melbourne VFL #12
1978 Hawthorn VFL #12
1979 North Melbourne VFL #12
1980 Richmond VFL #12
1981 Hawthorn VFL #12
1982 Essendon VFL #12
1983 Melbourne VFL #12
1984 Richmond VFL #12
1985 Essendon VFL #12
1986 Melbourne VFL #12
1987 Hawthorn VFL #14
1988 Eagles VFL #14
1989 Geelong VFL #14


Free kick differential wooden spoons VFL 1965-89

9 Hawthorn

4 Geelong
3 Richmond
2 Nth Melbourne, Melbourne, Essendon, Carlton
1 Eagles
0 Collingwood, St Kilda, Swans, Brisbane, Fitzroy, Bulldogs


AFL era free kick differential wooden spooners

1990 Geelong AFL #14
1991 Geelong AFL #15
1992 Swans AFL #15
1993 Adelaide AFL #15
1994 Melbourne AFL #15
1995 Fremantle AFL #16
1996 Adelaide AFL #16
1997 Melbourne AFL #16
1998 Melbourne AFL #16
1999 Melbourne AFL #16
2000 Carlton AFL #16
2001 Melbourne AFL #16
2002 Essendon AFL #16
2003 Essendon AFL #16
2004 Geelong AFL #16
2005 Swans AFL #16
2006 Swans AFL #16
2007 Swans AFL #16
2008 Hawks AFL #16
2009 Collingwood AFL #16
2010 Brisbane AFL #16
2011 Richmond AFL #17
2012 Brisbane AFL #18
2013 Brisbane AFL #18
2014 Fremantle AFL #18
2015 Geelong AFL #18
2016 Port Adelaide AFL #18
2017 Richmond AFL #18
2018 Richmond AFL #18
2019 Giants AFL #18
2020 Hawthorn AFL #18
2021 Richmond AFL #18
2022 Richmond AFL #18
2023 Richmond AFL #18
2024 to rd 9 Richmond AFL #18

AFL era

7 Richmond

5 Melbourne
4 Swans, Geelong
3 Brisbane
2 Essendon, Adelaide, Fremantle, Hawthorn
1 Carlton, Giants, Port Adelaide, Collingwood
0 Bulldogs, Eagles, Suns, North Melbourne, St Kilda


Overall since 1965:

11 Hawthorn(below 133 teams)
10 Richmond(below 151 teams)
8 Geelong
7 Melbourne
4 Essendon, Swans
3 Carlton, Brisbane
2 North Melbourne, Fremantle, Adelaide
1 Giants, Eagles, Port Adelaide, Collingwood

St Kilda, Bulldogs, Suns(from 14 seasons)


From Gill McLachlan's appointment as CEO in 2014 the table looks like this:

6 Richmond

1 Port Adelaide, Fremantle, Giants, Hawthorn, Geelong

From Steve Hocking's appointment as General Manager Football Operations in 2017 onwards:

5 Richmond
1 Hawthorn, Giants

Please note also, it is less likely for any team to finish #18 in an 18 team competition than number 12 in a 12 team competition. Richmond's free kick wooden spoons have seen them finish below more teams on the free kick ladder than any other club since 1965 when records began, all courtesy of course due to this current eye-watering run of free kick differential wooden spoons.

Do you happen to see anything standing out like a sore thumb PB?

Richmond on a teams in comp weighted basis now have the worst run of free kick differential wooden spoons since records began. 7 years ago they weren't even in the top 5. Now worse off than even the club Lou Richards dubbed the
'orrible Hawks in the 70's.

52w 4d 115l is Richmond's overall scoresheet on the free kick count in games from 2017 onwards. They win the free kick count 30% of the time, fail to win it 70% of the time. This is not the result of some random variance, it is way way too significant for that. This is clearly a team being officiated more harshly than all other teams. The exact reasons for that or how it comes to be, I have no idea. But as a Richmond supporter I will reserve the right to complain until it is corrected. And this is just free kicks. It is also very clear Richmond have been on the receiving end of all sorts of other adjudications wherever possible, as alluded to in my earlier post on this thread.
 
I guess it's nice some people (including oppo fans, don't know about here on BigFooty though) are finally starting to take notice and realise it wasn't just our poor discipline. Hopefully something changes, doubtful though.

Unrelated, but will the stand rule ever be removed? I know people have mentioned how it was brought in to combat us and I agree, it also just sucks to watch. Is there an actual article I can read about how Hocking was frustrated with the way we manned the mark? I've heard people talk about it but never seen it. Same with the alleged showing training videos of Richmond games etc.
 
That meeting will go nowhere due to the fact I can almost guarantee you he doesn't have the right numbers or the right questions to ask.

What Gale needs to show the AFL is:
1. Each clubs Frees Against (the ones they give away) statistics over the last year years. I am in the middle of the same analysis and from what I am seeing is that apart from a few teams like Hawthorn, every team on average is on significantly better behaviour against us. What he also should show is the number of frees that interstate teams give away at the G against us VS against other sides. Again, the interstate teams seem to be on fantastic behaviour against us at the G but get done in against other teams

2. Average Numbers of total frees per game. This is to dispute the argument that "Well your players are just so undisciplined that's why you are constantly at the bottom". Cool story bro, why is it then that we average around the middle of the pack for total frees per game? If we are just giving them away so much shouldn't our frees per game be so much higher?

3. The VFL free kick stats and compare them to the AFL. This would also shut up the "gamestyle" tools because if we are so undisciplined then how come the VFL team has a different free stats? Also do the umpires in the VFL have the same training?

Lastly the questions that should be ask are;
1. After seeing the data are you able to see our point of view?
2. If you were to put your finger on why this is happening what would be your view?
3. We would like to view and each and every piece of vision that the umpires have used for training for the last 3 years. <-- This is not really a question here but it is a request. The club needs to get their hands on this and just do a simple count of the times the vision includes a Tiger player giving away a free kick or being the player in the wrong. If that number is high and a lot higher than the rest of the other teams, we can say to the AFL that they are clearly conditioning their umpires to view Richmond players in a negative light.
Another point is that everything has changed apart from the jumper but we still get the same treatment.

Different coach, gamestyle, players, quality of team with almost 8 years of data. If every variable has changed yet the result is the same, then it has to be bias. There's nothing else that makes sense.
 
I posted this on a thread on the main board very relevant to this thread:


....A lot of your reasoning there sounds perfectly reasonable in isolation.

Let's however look at some facts. These are the teams to have the worst average free kick differential each year from 1965 to 2024. Interesting reading.

VFL era Free kick differential wooden spooners:

1965 Geelong VFL #12
1966 Geelong VFL #12
1967 Geelong VFL #12
1968 Richmond VFL #12
1969 Carlton VFL #12
1970 Carlton VFL #12
1971 Hawthorn VFL #12
1972 Hawthorn VFL #12
1973 Hawthorn VFL #12
1974 Hawthorn VFL #12
1975 Hawthorn VFL #12
1976 Hawthorn VFL #12
1977 North Melbourne VFL #12
1978 Hawthorn VFL #12
1979 North Melbourne VFL #12
1980 Richmond VFL #12
1981 Hawthorn VFL #12
1982 Essendon VFL #12
1983 Melbourne VFL #12
1984 Richmond VFL #12
1985 Essendon VFL #12
1986 Melbourne VFL #12
1987 Hawthorn VFL #14
1988 Eagles VFL #14
1989 Geelong VFL #14


Free kick differential wooden spoons VFL 1965-89

9 Hawthorn

4 Geelong
3 Richmond
2 Nth Melbourne, Melbourne, Essendon, Carlton
1 Eagles
0 Collingwood, St Kilda, Swans, Brisbane, Fitzroy, Bulldogs


AFL era free kick differential wooden spooners

1990 Geelong AFL #14
1991 Geelong AFL #15
1992 Swans AFL #15
1993 Adelaide AFL #15
1994 Melbourne AFL #15
1995 Fremantle AFL #16
1996 Adelaide AFL #16
1997 Melbourne AFL #16
1998 Melbourne AFL #16
1999 Melbourne AFL #16
2000 Carlton AFL #16
2001 Melbourne AFL #16
2002 Essendon AFL #16
2003 Essendon AFL #16
2004 Geelong AFL #16
2005 Swans AFL #16
2006 Swans AFL #16
2007 Swans AFL #16
2008 Hawks AFL #16
2009 Collingwood AFL #16
2010 Brisbane AFL #16
2011 Richmond AFL #17
2012 Brisbane AFL #18
2013 Brisbane AFL #18
2014 Fremantle AFL #18
2015 Geelong AFL #18
2016 Port Adelaide AFL #18
2017 Richmond AFL #18
2018 Richmond AFL #18
2019 Giants AFL #18
2020 Hawthorn AFL #18
2021 Richmond AFL #18
2022 Richmond AFL #18
2023 Richmond AFL #18
2024 to rd 9 Richmond AFL #18

AFL era

7 Richmond

5 Melbourne
4 Swans, Geelong
3 Brisbane
2 Essendon, Adelaide, Fremantle, Hawthorn
1 Carlton, Giants, Port Adelaide, Collingwood
0 Bulldogs, Eagles, Suns, North Melbourne, St Kilda


Overall since 1965:

11 Hawthorn(below 133 teams)
10 Richmond(below 151 teams)
8 Geelong
7 Melbourne
4 Essendon, Swans
3 Carlton, Brisbane
2 North Melbourne, Fremantle, Adelaide
1 Giants, Eagles, Port Adelaide, Collingwood

St Kilda, Bulldogs, Suns(from 14 seasons)


From Gill McLachlan's appointment as CEO in 2014 the table looks like this:

6 Richmond

1 Port Adelaide, Fremantle, Giants, Hawthorn, Geelong

From Steve Hocking's appointment as General Manager Football Operations in 2017 onwards:

5 Richmond
1 Hawthorn, Giants

Please note also, it is less likely for any team to finish #18 in an 18 team competition than number 12 in a 12 team competition. Richmond's free kick wooden spoons have seen them finish below more teams on the free kick ladder than any other club since 1965 when records began, all courtesy of course due to this current eye-watering run of free kick differential wooden spoons.

Do you happen to see anything standing out like a sore thumb PB?

Richmond on a teams in comp weighted basis now have the worst run of free kick differential wooden spoons since records began. 7 years ago they weren't even in the top 5. Now worse off than even the club Lou Richards dubbed the
'orrible Hawks in the 70's.

52w 4d 115l is Richmond's overall scoresheet on the free kick count in games from 2017 onwards. They win the free kick count 30% of the time, fail to win it 70% of the time. This is not the result of some random variance, it is way way too significant for that. This is clearly a team being officiated more harshly than all other teams. The exact reasons for that or how it comes to be, I have no idea. But as a Richmond supporter I will reserve the right to complain until it is corrected. And this is just free kicks. It is also very clear Richmond have been on the receiving end of all sorts of other adjudications wherever possible, as alluded to in my earlier post on this thread.
There's also the numbers for how big the differential is. A team could lose the free kick count every week by 1 and really not be impacted.

We are massive outliers in terms of losing the free kick count by 10+. There was a graph posted at some stage showing every team winning vs losing by 10+ and we're off the charts.

Lastly, 50m penalties aren't counted in overall free kick counts and are notoriously difficult to find. We also comfortably lead the negative 50m penalty differential since 2017 so it skews it even more.
 
Back
Top