Analysis The Stats and nothing but the Stats

Remove this Banner Ad

A club related stat:

The most common match-up we've had since the AFL became an 18-team competition is Sydney-GWS. These two clubs have already faced each other 26 times, including three finals. As of Round 3, 2024, the Giants have played 277 games in the AFL, that means 10.65% of them have been against the Swans!

And that's not including all the practice matches as well (another 1+ per season - pretty sure there were times when we used to have two official 'NAB' pre-season games that we would also play an unofficial practice with GWS as well as one of the NAB games).
 
Did you exclude last round from Harry's 18 average? Seems impossible that he maintained an average of 18 disposals when he got taken out of the game in the first few minutes of one of our three only games.
 

Log in to remove this ad.

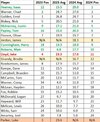
Just looking purely at avg disposals... a few risers and one pretty significant slider... small sample size atm, but still a couple of interesting changes

View attachment 1944596
Given Lloyd's change in role that's not awfully surprising. Don't get a lot of kick-ins on the wing. Also interesting that we appear to have had fewer behinds scored against us.
 
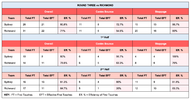
These are getting more and more deflating to track with each week...

Screen Shot 2024-04-02 at 6.08.01 pm.png

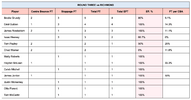
Screen Shot 2024-04-02 at 6.08.28 pm.png

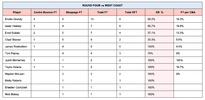
After the West Coast match and during the bye I will post a compilation of the numbers from all our games so far, just to see where we're at vs other teams, and where each individual is at.
 
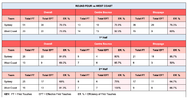
These are getting more and more deflating to track with each week...

View attachment 1947784

View attachment 1947786

After the West Coast match and during the bye I will post a compilation of the numbers from all our games so far, just to see where we're at vs other teams, and where each individual is at.
Seemed to be fairly evenly matched stats wise, although we were more effective with our first touches. But we broke down pretty soon after that on quite a few occasions.
 

(Log in to remove this ad.)

Thanks caesar88 - appreciate your efforts with this. Are you still going to consolidate the stats for our first 5 match block? I'm looking forward to that!
 
No idea WTF any of this means but some might enjoy it.

(I love our backline)


Not sure that this fully encapsulates backline performance but it is interesting. The top 7 makes sense to the eye but Melbourne being that far down doesn't (to mine anyway).
Needs some obvious relationship to points scored against.
One of the big factors affecting backline performance is how well the midfield does at forcing entries to be shallow and wide rather deep into F50. It can be measured but....
 
No idea WTF any of this means but some might enjoy it.

(I love our backline)


From what I can make out:
We allow 14% of oppositions inside 50s to result in a mark, the best in the comp
For every 1 on 1 contest in the defensive 50 we lost 1 every 5 (4th best)

The other 2 seem to contradict each other which makes me think I just don't understand them
 
Looks like us and Carlton go down the corridor exiting 50 the least and all teams go down the wings the vast majority of time.
I mean, as we watch the game we can see it, but nice to have it confirmed in comparison to others visually like this.
 

Remove this Banner Ad

Back
Top